Rogers 2009 Annual Report Download - page 37
Download and view the complete annual report
Please find page 37 of the 2009 Rogers annual report below. You can navigate through the pages in the report by either clicking on the pages listed below, or by using the keyword search tool below to find specific information within the annual report.-
 1
1 -
2
-
3
-
4
-
5
-
6
-
7
-
8
-
9
-
10
-
11
-
12
-
13
-
14
-
15
-
16
-
17
-
18
-
19
-
20
-
21
-
22
-
23
-
24
-
25
-
26
-
 27
27 -
 28
28 -
 29
29 -
 30
30 -
 31
31 -
 32
32 -
 33
33 -
 34
34 -
 35
35 -
 36
36 -
 37
37 -
 38
38 -
 39
39 -
 40
40 -
 41
41 -
 42
42 -
 43
43 -
 44
44 -
 45
45 -
 46
46 -
 47
47 -
48
-
49
-
50
-
51
-
52
-
53
-
54
-
55
-
56
-
57
-
58
-
59
-
60
-
61
-
62
-
63
-
64
-
65
-
66
-
67
-
68
-
69
-
70
-
71
-
72
-
73
-
74
-
75
-
76
-
77
-
78
-
79
-
80
-
81
-
82
-
83
-
84
-
85
-
86
-
87
-
88
-
89
-
90
-
91
-
92
-
93
-
94
-
95
-
96
-
97
-
98
-
99
-
100
-
101
-
102
-
103
-
104
-
105
-
106
-
107
-
108
-
109
-
110
-
111
-
112
-
113
-
114
-
115
-
116
-
117
-
118
-
119
-
120
-
121
-
122
-
123
-
124
-
125
-
126
-
127
-
128
-
129
-
130
 |
 |

ROGERS COMMUNICATIONS INC. 2009 ANNUAL REPORT 41
MANAGEMENT’S DISCUSSION AND ANALYSIS OF FINANCIAL CONDITION AND RESULTS OF OPERATIONS
Migration to Digital Media
The media landscape is changing significantly; driven by the
following major forces impacting audience and advertiser
behaviour:
• Digitizationofcontent;
• Roll-out and extensive availability of high-speed broadband
networks;
• Increasingly fragmented and time-shifted audience time and
attention;
• Explosionofuser-generated,freeandpiratedcontent;and
• Marketerssearchingforhigher-ROImediavehicles.
The impact of the foregoing is that audiences are migrating a
portion of their time and attention from traditional to online and
other digital media. As a result, advertisers are following this trend
by shifting a portion of their spending from traditional to digital
media formats.
Consolidation of Industry Competitors
Ownership of Canadian radio and TV stations has consolidated
through several large acquisitions in the sector by other media
companies over the past five years. This has resulted in the Canadian
industry being left with fewer owners but larger competitors in the
media marketplace.
MEDIA OPERATING AND FINANCIAL RESULTS
Media’s revenues primarily consist of:
• Advertisingrevenues;
• Circulationrevenues;
• Subscriptionrevenues;
• Retailproductsales;and
• Salesoftickets,receiptsofMLBrevenuesharingandconcession
sales associated with Rogers Sports Entertainment.
Media’s operating expenses consist of:
• Costofsales,whichisprimarilycomprisedofthecostofretail
products sold by The Shopping Channel;
• Salesandmarketingexpenses;and
• Operating,generalandadministrativeexpenses,whichinclude
programming costs, production expenses, circulation expenses,
Blue Jays player salaries and other back-office support functions.
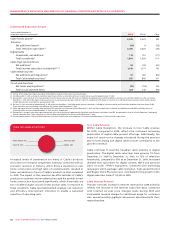
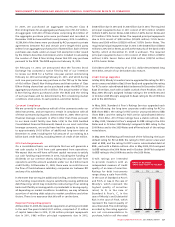
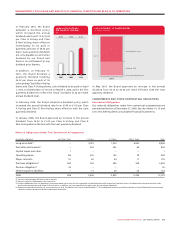
Media Operating Revenue
The overall decrease in Media revenue in 2009, compared to 2008,
was reflective of a soft advertising market and a challenging retail
environment which resulted in lower revenues in Radio, Publishing
and The Shopping Channel. However, starting in the third quarter
of 2009, the rate of year-over-year decline in advertising sales
began to moderate for the first time in several quarters. Despite
the soft advertising market, Sportsnet delivered organic growth
and Television delivered revenues in line with 2008 levels due to the
market’s favourable response to the planned investment in Citytv’s
programming schedule. Sports Entertainment revenue was lower
mainly as a result of hosting only one Buffalo Bills NFL game in 2009
versus two in 2008.
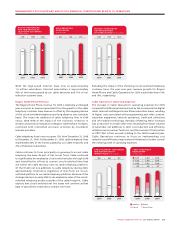
Media Operating Expenses
The decrease in Media’s operating expenses in 2009, compared to
2008, was driven by a focused cost reduction program across all of
Media’s divisions and lower variable costs associated with printing
and production at Publishing and retail sales at The Shopping
Channel. This was offset by planned increases in programming
costs at Sportsnet and Television.
Media Adjusted Operating Profit
The decrease in Media’s adjusted operating profit for 2009,
compared to 2008, primarily reflects revenue and expense changes
discussed above and overall is reflective of the challenging
economic conditions and the resultant declines in advertising and
retail sales activity.
(1) The operating results of channel m are included in Media’s results of operations from the date of acquisition on April 30, 2008.
(2) The operating results of Outdoor Life Network are included in Media’s results of operations from the date of acquisition on July 31, 2008.
(3) As defined. See the section entitled “Key Performance Indicators and Non-GAAP Measures”.
(4) See the section entitled “Stock-based Compensation”.
(5) Relates to the settlement of pension obligations for all employees in the pension plans who had retired as of January 1, 2009 as a result of annuity purchases by the Company’s pension plans.
(6) For the year ended December 31, 2009 and December 31, 2008, costs incurred relate to severances resulting from the targeted restructuring of our employee base to improve our cost structure
in light of the current economic and competitive conditions.
(7) Relates to the termination and release of certain Blue Jays players from the remaining term of their contracts.
(8) Relates to an adjustment for CRTC Part II fees related to prior periods.
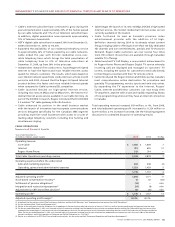
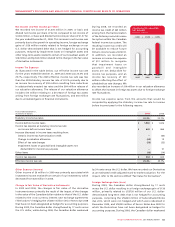
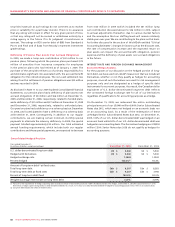
Summarized Media Financial Results
Years ended December 31,
(In millions of dollars, except margin) 2009 2008(1)(2) %Chg
Operating revenue $ 1,407 $ 1,496 (6)
Operating expenses before the undernoted 1,288 1,354 (5)
Adjusted operating profit(3) 119 142 (16)
Stock-based compensation recovery(4) 8 17 (53)
Settlement of pension obligations(5) (15) – n/m
Integration and restructuring expenses(6) (35) (11) n/m
Contract termination fee(7) (19) – n/m
Adjustment for CRTC Part II fees decision(8) 15 (6) n/m
Operating profit(3) $ 73 $ 142 (49)
Adjusted operating profit margin(3) 8.5% 9.5%
Additions to property, plant and equipment(3) $ 62 $ 81 (23)