Rogers 2009 Annual Report Download - page 81
Download and view the complete annual report
Please find page 81 of the 2009 Rogers annual report below. You can navigate through the pages in the report by either clicking on the pages listed below, or by using the keyword search tool below to find specific information within the annual report.-
 1
1 -
2
-
3
-
4
-
5
-
6
-
7
-
8
-
9
-
10
-
11
-
12
-
13
-
14
-
15
-
16
-
17
-
18
-
19
-
20
-
21
-
22
-
23
-
24
-
25
-
26
-
27
-
28
-
29
-
30
-
31
-
32
-
33
-
34
-
35
-
36
-
37
-
38
-
39
-
40
-
41
-
42
-
43
-
44
-
45
-
46
-
47
-
48
-
49
-
50
-
51
-
52
-
53
-
54
-
55
-
56
-
57
-
58
-
59
-
60
-
61
-
62
-
63
-
64
-
65
-
66
-
67
-
68
-
69
-
70
-
 71
71 -
 72
72 -
 73
73 -
 74
74 -
 75
75 -
 76
76 -
 77
77 -
 78
78 -
 79
79 -
 80
80 -
 81
81 -
 82
82 -
 83
83 -
 84
84 -
 85
85 -
 86
86 -
 87
87 -
 88
88 -
 89
89 -
 90
90 -
 91
91 -
92
-
93
-
94
-
95
-
96
-
97
-
98
-
99
-
100
-
101
-
102
-
103
-
104
-
105
-
106
-
107
-
108
-
109
-
110
-
111
-
112
-
113
-
114
-
115
-
116
-
117
-
118
-
119
-
120
-
121
-
122
-
123
-
124
-
125
-
126
-
127
-
128
-
129
-
130
 |
 |

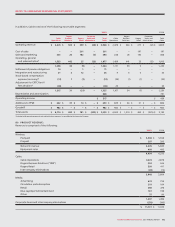
ROGERS COMMUNICATIONS INC. 2009 ANNUAL REPORT 85
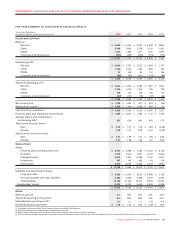
CONSOLIDATED STATEMENTS OF SHAREHOLDERS’ EQUITY
(IN MILLIONS OF CANADIAN DOLLARS)
Class A Voting shares Class B Non-Voting shares
Contributed
surplus
Retained
earnings
(Restated -
note 2(p)(i))
Accumulated
other
comprehensive
income
(loss)
Total
shareholders’
equity
(Restated -
note 2(p)(i))
Years ended December 31, 2009 and 2008 Amount
Number
of shares
(000s) Amount
Number
of shares
(000s)
Balances, December 31, 2007 $ 72 112,462 $ 471 527,005 $ 3,689 $ 342 $ 50 $ 4,624
Change in accounting policy related to
goodwill and intangible assets (note 2(p)(i)) –––––(11) –(11)
As restated, January 1, 2008 72 112,4 62 471 527,005 3,689 331 50 4,613
Net income for the year –––––1,002 –1,002
Shares issued on exercise
of stock options – – 21 502 –––21
Dividends declared –––––(638) –(638)
Repurchase of Class B
Non-Voting shares (note 18(c)) – – (4) (4,077) (129) (4) –(137)
Other comprehensive loss ––––––(145) (145)
Balances, December 31, 2008 72 112,462 488 523,430 3,560 691 (95) 4,716
Net income for the year –––––1,478 –1,478
Shares issued on exercise
of stock options – – 9 294 – – – 9
Dividends declared –––––(721) –(721)
Repurchase of Class B
Non-Voting shares (note 18(c)) – – (41) (43,776) (1,256) (50) –(1,347)
Other comprehensive income ––––––138 138
Balances, December 31, 2009 $ 72 112,462 $ 456 479,948 $ 2,304 $ 1,398 $ 43 $ 4,273
See accompanying notes to consolidated financial statements.