Rogers 2009 Annual Report Download - page 73
Download and view the complete annual report
Please find page 73 of the 2009 Rogers annual report below. You can navigate through the pages in the report by either clicking on the pages listed below, or by using the keyword search tool below to find specific information within the annual report.-
 1
1 -
2
-
3
-
4
-
5
-
6
-
7
-
8
-
9
-
10
-
11
-
12
-
13
-
14
-
15
-
16
-
17
-
18
-
19
-
20
-
21
-
22
-
23
-
24
-
25
-
26
-
27
-
28
-
29
-
30
-
31
-
32
-
33
-
34
-
35
-
36
-
37
-
38
-
39
-
40
-
41
-
42
-
43
-
44
-
45
-
46
-
47
-
48
-
49
-
50
-
51
-
52
-
53
-
54
-
55
-
56
-
57
-
58
-
59
-
60
-
61
-
62
-
 63
63 -
 64
64 -
 65
65 -
 66
66 -
 67
67 -
 68
68 -
 69
69 -
 70
70 -
 71
71 -
 72
72 -
 73
73 -
 74
74 -
 75
75 -
 76
76 -
 77
77 -
 78
78 -
 79
79 -
 80
80 -
 81
81 -
 82
82 -
 83
83 -
84
-
85
-
86
-
87
-
88
-
89
-
90
-
91
-
92
-
93
-
94
-
95
-
96
-
97
-
98
-
99
-
100
-
101
-
102
-
103
-
104
-
105
-
106
-
107
-
108
-
109
-
110
-
111
-
112
-
113
-
114
-
115
-
116
-
117
-
118
-
119
-
120
-
121
-
122
-
123
-
124
-
125
-
126
-
127
-
128
-
129
-
130
 |
 |

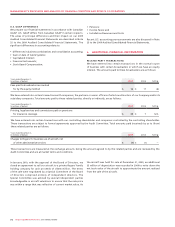
ROGERS COMMUNICATIONS INC. 2009 ANNUAL REPORT 77
MANAGEMENT’S DISCUSSION AND ANALYSIS OF FINANCIAL CONDITION AND RESULTS OF OPERATIONS
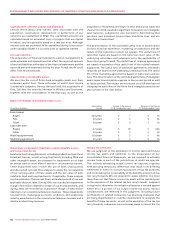
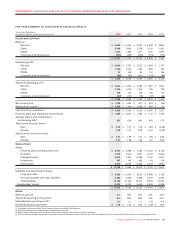
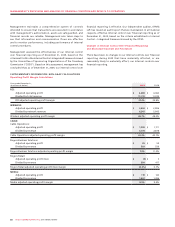
(1) See section entitled “Stock-based Compensation”.
(2) Relates to the settlement of pension obligations for all employees in the pension plans who had retired as of January 1, 2009 as a result of annuity purchases by the Company’s pension plans.
(3) Costs incurred relate to severances resulting from the restructuring of our employee base to combine the Cable and Wireless businesses into a communications organization and to improve
our cost structure in light of the current economic and competitive conditions, severances and restructuring expenses related to the outsourcing of certain information technology functions,
the integration of Call-Net, Futureway and Aurora Cable, the restructuring of RBS, and the closure of certain Rogers Retail stores.
(4) Relates to the termination and release of certain Blue Jays players from the remaining term of their contracts.
(5) Related to an adjustment of CRTC Part II fees related to prior periods. The adjustments related to Part II CRTC fees are applicable to the quarters in which they occur and only partially impact
the full years. See the section entitled “Government Regulation and Regulatory Developments”.
(6) As defined. See the section entitled “Key Performance Indicators and Non-GAAP Measures”.
(7) In the fourth quarter of 2009 and 2008, we determined that the fair values of certain broadcasting assets were lower than their carrying values. This primarily resulted from weakening industry
expectations and declines in advertising revenues amidst the slowing economy. As a result, we recorded an aggregate non-cash impairment charge of $18 million in 2009 with the following
components: $5 million related to broadcast licences and $13 million related to other long-term assets; and $294 million in 2008 with the following components: $154 million related to goodwill,
$75 million related to broadcast licences and $65 million related to intangible assets and other long-term assets.
2009 2008
(in millions of dollars,
except per share amounts) Q1 Q2 Q3 Q4 Q1 Q2 Q3 Q4
Operating Revenue
Wireless $ 1,544 $ 1,616 $ 1,760 $ 1,734 $ 1,431 $ 1,522 $ 1,727 $ 1,655
Cable 968 972 989 1,019 925 938 961 985
Media 284 366 364 393 307 409 386 394
Corporate and eliminations (49) (63) (77) (89) (54) (66) (92) (93)
2,747 2,891 3,036 3,057 2,609 2,803 2,982 2,941
Operating profit (loss) before the undernoted
Wireless 710 742 846 744 705 769 693 639
Cable 324 332 329 325 303 304 318 313
Media (10) 37 36 52 2 52 43 46
Corporate and eliminations (19) (28) (30) (20) (26) (36) (29) (30)
1,005 1,083 1,181 1,101 984 1,089 1,025 968
Stock-based compensation recovery (expense)(1) 81 (13) (6) (29) 116 (53) 62 (25)
Settlement of pension obligations(2) – – – (30) – – – –
Integration and restructuring expenses(3) (4) (37) (11) (65) (5) (3) (2) (41)
Contract termination fees(4) – – (12) (7) – – – –
Adjustment for CRTC Part II fees decision(5) – – – 79 – (37) – –
Operating profit(6) 1,082 1,033 1,152 1,049 1,095 996 1,085 902
Depreciation and amortization 444 446 416 424 440 420 429 471
Impairment losses on goodwill, intangible assets
and other long-term assets(7) – – – 18 – – – 294
Operating income 638 587 736 607 655 576 656 137
Interest on long-term debt (152) (156) (166) (173) (138) (133) (147) (157)
Debt issuance costs – (5) – (6) – – (16) –
Other income (expense) (17) 73 44 (30) (3) 11 16 (31)
Income tax expense (160) (125) (129) (88) (170) (153) (14) (87)
Net income (loss) for the period $ 309 $ 374 $ 485 $ 310 $ 344 $ 301 $ 495 $ (138)
Net income (loss) per share:
Basic $ 0.49 $ 0.59 $ 0.79 $ 0.51 $ 0.54 $ 0.47 $ 0.78 $ (0.22)
Diluted $ 0.49 $ 0.59 $ 0.79 $ 0.51 $ 0.54 $ 0.47 $ 0.78 $ (0.22)
Additions to property, plant and equipment(6) $ 359 $ 434 $ 491 $ 571 $ 321 $ 481 $ 436 $ 783
Quarterly Consolidated Financial Summary