Rogers 2009 Annual Report Download - page 119
Download and view the complete annual report
Please find page 119 of the 2009 Rogers annual report below. You can navigate through the pages in the report by either clicking on the pages listed below, or by using the keyword search tool below to find specific information within the annual report.-
 1
1 -
2
-
3
-
4
-
5
-
6
-
7
-
8
-
9
-
10
-
11
-
12
-
13
-
14
-
15
-
16
-
17
-
18
-
19
-
20
-
21
-
22
-
23
-
24
-
25
-
26
-
27
-
28
-
29
-
30
-
31
-
32
-
33
-
34
-
35
-
36
-
37
-
38
-
39
-
40
-
41
-
42
-
43
-
44
-
45
-
46
-
47
-
48
-
49
-
50
-
51
-
52
-
53
-
54
-
55
-
56
-
57
-
58
-
59
-
60
-
61
-
62
-
63
-
64
-
65
-
66
-
67
-
68
-
69
-
70
-
71
-
72
-
73
-
74
-
75
-
76
-
77
-
78
-
79
-
80
-
81
-
82
-
83
-
84
-
85
-
86
-
87
-
88
-
89
-
90
-
91
-
92
-
93
-
94
-
95
-
96
-
97
-
98
-
99
-
100
-
101
-
102
-
103
-
104
-
105
-
106
-
107
-
108
-
 109
109 -
 110
110 -
 111
111 -
 112
112 -
 113
113 -
 114
114 -
 115
115 -
 116
116 -
 117
117 -
 118
118 -
 119
119 -
 120
120 -
 121
121 -
 122
122 -
 123
123 -
 124
124 -
 125
125 -
 126
126 -
 127
127 -
 128
128 -
 129
129 -
130
 |
 |

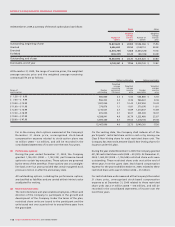
ROGERS COMMUNICATIONS INC. 2009 ANNUAL REPORT 123
NOTES TO CONSOLIDATED FINANCIAL STATEMENTS
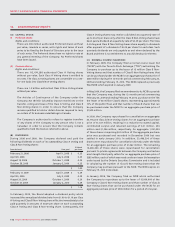
The consolidated financial statements of the Company have been
prepared in accordance with GAAP as applied in Canada. In the
following respects, GAAP, as applied in the United States, differs
from that applied in Canada.
If United States GAAP were employed, net income for the years
ended December 31, 2009 and 2008 would be adjusted as follows:
25. CANADIAN AND UNITED STATES ACCOUNTING POLICY DIFFERENCES:
2009 2008
Net income for the year based on Canadian GAAP $ 1,478 $ 1,002
Gain on sale of cable systems (b) (4) (4)
Capitalized interest, net of related depreciation (c) 611
Financial instruments (d) 145 (76)
Stock-based compensation (e) 13 (32)
Net periodic pension cost (f) 3–
Income taxes (g) (28) 90
Installation revenues and costs, net (h) 410
Other –(1)
Net income for the year based on United States GAAP $ 1,617 $ 1,000
Net income per share based on United States GAAP:
Basic $ 2.60 $ 1.57
Diluted 2.60 1.57
If United States GAAP were employed, comprehensive income for
the years ended December 31, 2009 and December 31, 2008 would
be adjusted as follows:
2009 2008
Comprehensive income for the year based on Canadian GAAP $ 1,616 $ 857
Impact of United States GAAP differences on net income 139 (2)
Reclassification to net income of change in fair value of derivative instruments not accounted for
as hedges under United States GAAP, net of income taxes of $26 (2008 – $88) (d) (113) 5
Change in funded status of pension plans for unrecognized amounts, net of income taxes of $16 (2008 – $6) (f) (45) 16
Comprehensive income for the year based on United States GAAP $ 1,597 $ 876
The cumulative effect of these adjustments on the consolidated
shareholders’ equity of the Company is as follows:
2009 2008
Shareholders' equity based on Canadian GAAP $ 4,273 $ 4,716
Cumulative impact of differences in business combinations and consolidation accounting (a) (8) (8)
Gain on sale of cable systems (b) 101 105
Capitalized interest (c) 85 79
Financial instruments (d) 49 43
Stock-based compensation (e) 13 8
Pension liability (f), (k) (165) (107)
Income taxes (g) (14) (25)
Installation revenues and costs, net (h) 16 12
Other (7) (7)
Shareholders' equity based on United States GAAP $ 4,343 $ 4,816