Rogers 2009 Annual Report Download - page 114
Download and view the complete annual report
Please find page 114 of the 2009 Rogers annual report below. You can navigate through the pages in the report by either clicking on the pages listed below, or by using the keyword search tool below to find specific information within the annual report.-
 1
1 -
2
-
3
-
4
-
5
-
6
-
7
-
8
-
9
-
10
-
11
-
12
-
13
-
14
-
15
-
16
-
17
-
18
-
19
-
20
-
21
-
22
-
23
-
24
-
25
-
26
-
27
-
28
-
29
-
30
-
31
-
32
-
33
-
34
-
35
-
36
-
37
-
38
-
39
-
40
-
41
-
42
-
43
-
44
-
45
-
46
-
47
-
48
-
49
-
50
-
51
-
52
-
53
-
54
-
55
-
56
-
57
-
58
-
59
-
60
-
61
-
62
-
63
-
64
-
65
-
66
-
67
-
68
-
69
-
70
-
71
-
72
-
73
-
74
-
75
-
76
-
77
-
78
-
79
-
80
-
81
-
82
-
83
-
84
-
85
-
86
-
87
-
88
-
89
-
90
-
91
-
92
-
93
-
94
-
95
-
96
-
97
-
98
-
99
-
100
-
101
-
102
-
103
-
 104
104 -
 105
105 -
 106
106 -
 107
107 -
 108
108 -
 109
109 -
 110
110 -
 111
111 -
 112
112 -
 113
113 -
 114
114 -
 115
115 -
 116
116 -
 117
117 -
 118
118 -
 119
119 -
 120
120 -
 121
121 -
 122
122 -
 123
123 -
 124
124 -
125
-
126
-
127
-
128
-
129
-
130
 |
 |

118 ROGERS COMMUNICATIONS INC. 2009 ANNUAL REPORT
NOTES TO CONSOLIDATED FINANCIAL STATEMENTS
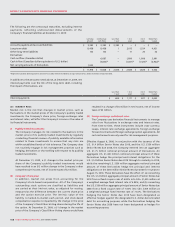
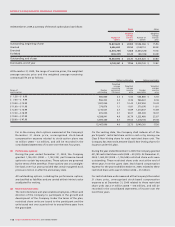
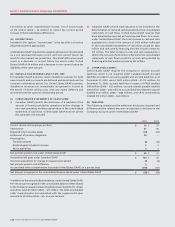
At December 31, 2009, a summary of the stock option plans is as follows:
2009 2008
Number of
options
Weighted
average
exercise
price
Number of
options
Weighted
average
exercise
price
Outstanding, beginning of year 13,841,620 $ 20.80 15,586,066 $ 15.96
Granted 2,636,600 29.50 2,148,110 38.83
Exercised (2,604,787) 12.88 (3,804,520) 10.55
Forfeited (406,337) 32.20 (88,036) 34.69
Outstanding, end of year 13,467,096 $ 23.73 13,841,620 $ 20.80
Exercisable, end of year 8,149,361 $ 17.56 9,228,740 $ 13.82
At December 31, 2009, the range of exercise prices, the weighted
average exercise price and the weighted average remaining
contractual life are as follows:
Options outstanding Options exercisable
Range of
exercise prices
Number
outstanding
Weighted
average
remaining
contractual
life (years)
Weighted
average
exercise
price
Number
exercisable
Weighted
average
exercise
price
$ 1.38 – $ 6.99 586,880 2.5 $ 5.50 586,880 $ 5.50
$ 7.00 – $ 9.99 966,422 3.4 8.36 966,422 8.36
$ 10.00 – $ 10.99 1,907,050 3.7 10.43 1,907,050 10.43
$ 11.00 – $ 11.99 370,876 1.1 11.81 370,876 11. 81
$ 12.00 – $ 16.99 1,214,547 2.7 13.89 1,214,547 13.89
$ 17.00 – $ 18.99 435,000 0.7 18.07 435,000 18.07
$ 19.00 – $ 37.99 4,288,941 4.9 26.79 1,323,480 22.87
$ 38.00 – $ 47.99 3,697,380 4.7 39.03 1,345,106 39.08
13,467,096 4.0 23.73 8,149,361 17.56
For in-the-money stock options measured at the Company’s
December 31 share price, unrecognized stock-based
compensation expense related to stock-option plans was
$5 million (2008 – $3 million), and will be recorded in the
consolidated statements of income over the next four years.
(ii) Performance options:
During the year ended December 31, 2009, the Company
granted 1,156,200 (2008 – 1,142,300) performance-based
options to certain key executives. These options are governed
by the terms of the 2000 Plan. These options vest on a straight-
line basis over four years provided that certain targeted stock
prices are met on or after the anniversary date.
All outstanding options, including the performance options,
are classified as liabilities and are carried at their intrinsic value
as adjusted for vesting.
(b) Restricted share units:
The restricted share unit plan enables employees, officers and
directors of the Company to participate in the growth and
development of the Company. Under the terms of the plan,
restricted share units are issued to the participant and the
units issued vest over a period not to exceed three years from
the grant date.
On the vesting date, the Company shall redeem all of the
participants’ restricted share units in cash or by issuing one
Class B Non-Voting share for each restricted share unit. The
Company has reserved 4,000,000 Class B Non-Voting shares for
issuance under this plan.
During the year ended December 31, 2009, the Company granted
431,185 restricted share units (2008 – 451,535). At December 31,
2009, 1,060,223 (2008 – 1,126,548) restricted share units were
outstanding. These restricted share units vest at the end of
three years from the grant date. Stock-based compensation
expense for the year ended December 31, 2009, related to these
restricted share units was $7 million (2008 – $7 million).
For restricted share units measured at the Company’s December
31 share price, unrecognized stock-based compensation
expense as at December 31, 2009 related to these restricted
share units was $17 million (2008 – $16 million), and will be
recorded in the consolidated statements of income over the
next three years.