Rogers 2009 Annual Report Download - page 26
Download and view the complete annual report
Please find page 26 of the 2009 Rogers annual report below. You can navigate through the pages in the report by either clicking on the pages listed below, or by using the keyword search tool below to find specific information within the annual report.-
 1
1 -
2
-
3
-
4
-
5
-
6
-
7
-
8
-
9
-
10
-
11
-
12
-
13
-
14
-
15
-
 16
16 -
 17
17 -
 18
18 -
 19
19 -
 20
20 -
 21
21 -
 22
22 -
 23
23 -
 24
24 -
 25
25 -
 26
26 -
 27
27 -
 28
28 -
 29
29 -
 30
30 -
 31
31 -
 32
32 -
 33
33 -
 34
34 -
 35
35 -
 36
36 -
37
-
38
-
39
-
40
-
41
-
42
-
43
-
44
-
45
-
46
-
47
-
48
-
49
-
50
-
51
-
52
-
53
-
54
-
55
-
56
-
57
-
58
-
59
-
60
-
61
-
62
-
63
-
64
-
65
-
66
-
67
-
68
-
69
-
70
-
71
-
72
-
73
-
74
-
75
-
76
-
77
-
78
-
79
-
80
-
81
-
82
-
83
-
84
-
85
-
86
-
87
-
88
-
89
-
90
-
91
-
92
-
93
-
94
-
95
-
96
-
97
-
98
-
99
-
100
-
101
-
102
-
103
-
104
-
105
-
106
-
107
-
108
-
109
-
110
-
111
-
112
-
113
-
114
-
115
-
116
-
117
-
118
-
119
-
120
-
121
-
122
-
123
-
124
-
125
-
126
-
127
-
128
-
129
-
130
 |
 |

30 ROGERS COMMUNICATIONS INC. 2009 ANNUAL REPORT
MANAGEMENT’S DISCUSSION AND ANALYSIS OF FINANCIAL CONDITION AND RESULTS OF OPERATIONS
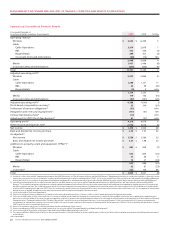
The increase in cost of equipment sales for 2009, compared to 2008,
was primarily the result of the higher mix of smartphone sales.
The year-over-year decrease in sales and marketing expenses for
2009, compared to 2008, was driven by cost containment initiatives.
The year-over-year increase in operating, general and administrative
expenses for 2009, compared to 2008, excluding retention spending
discussed below, were partially driven by growth in the Wireless
subscriber base. In addition, increases in information technology
and customer care as a result of the complexity of supporting
more sophisticated devices and services were predominately
offset by savings related to operating and scale efficiencies across
various functions.
Total retention spending, including subsidies on handset upgrades,
was $588 million in 2009, compared to $536 million in 2008. The
retention spending for 2009 increased compared to 2008 as a result
of higher upgrade activity and an increase in the mix of upgrades
more heavily towards smartphone devices by existing subscribers
during 2009.
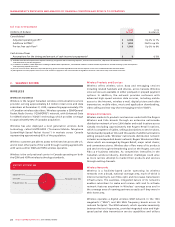
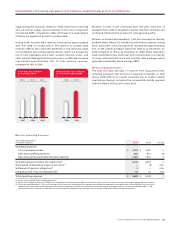
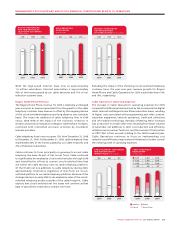
Wireless Adjusted
Operating Profit
The 8% year-over-year increase
in adjusted operating profit and
the 48.7% adjusted operating
profit margin on network
reve n u e (w h i c h e xc l u d e s
equipment sales revenue) for
2009 primarily reflects the
increase in network revenue
and the decrease in sale s
a n d ma r ke t i n g e x p e n s e s
discussed above.
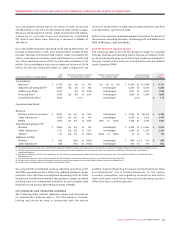
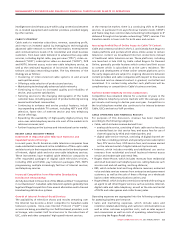
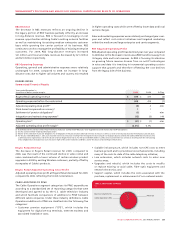
Wireless Additions to
Property, Plant and Equipment
Wireless additions to PP&E
are classified into the following
categories:
Additions to Wireless PP&E for 2009 reflect spending on network
capacity, such as radio channel additions and network enhancing
features. Additions to PP&E associated with the deployment of our
HSPA network were mainly for the continued roll-out to various
markets across Canada along with upgrades to the network to
enable higher throughput speeds. Other network-related PP&E
additions included national site build activities, test and monitoring
equipment, network sectorization work, operating support system
activities, investments in network reliability and renewal initiatives,
infrastructure upgrades, and new product platforms. Information
technology and other wireless specific system initiatives included
billing and back-office system upgrades, and other facilities and
equipment spending.
HSPA spending increased year-over-year due to the expansion of 21
Mbps speeds in major urban centres. Capacity spending increased
over the same period in the prior year due to the acquisition of
IP transmission interfaces and augmentation to the radio access
network to meet demand for migrations from GSM to HSPA due
to a faster adoption of 3G devices. Offsetting these increases from
the corresponding period of the prior year was lower spending
on enhancements to services and capabilities included in other
network additions due to lower site build activity.
20092008
2007
200
8
2007
2009
$3,042$2,806$2,589
WIRELESS ADJUSTED
OPERATING PROFIT
(In millions of dollars)
Years ended December 31,
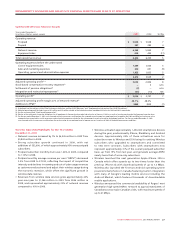
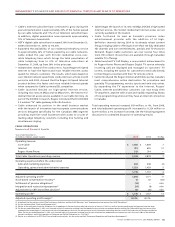
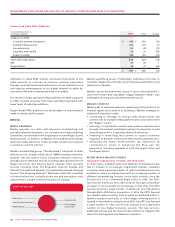
(In millions of dollars) 2009 2008 %Chg
Additions to PP&E
High-Speed Packet Access (“HSPA”) $ 345 $ 315 10
Network - capacity 239 200 20
Network - other 152 262 (42)
Information technology and other 129 152 (15)
Total additions to PP&E $ 865 $ 929 (7)
Other 15%
Network 45%
HSPA 40%
WIRELESS ADDITIONS TO PP&E
(%)