Rogers 2009 Annual Report Download - page 24
Download and view the complete annual report
Please find page 24 of the 2009 Rogers annual report below. You can navigate through the pages in the report by either clicking on the pages listed below, or by using the keyword search tool below to find specific information within the annual report.-
 1
1 -
2
-
3
-
4
-
5
-
6
-
7
-
8
-
9
-
10
-
11
-
12
-
13
-
 14
14 -
 15
15 -
 16
16 -
 17
17 -
 18
18 -
 19
19 -
 20
20 -
 21
21 -
 22
22 -
 23
23 -
 24
24 -
 25
25 -
 26
26 -
 27
27 -
 28
28 -
 29
29 -
 30
30 -
 31
31 -
 32
32 -
 33
33 -
 34
34 -
35
-
36
-
37
-
38
-
39
-
40
-
41
-
42
-
43
-
44
-
45
-
46
-
47
-
48
-
49
-
50
-
51
-
52
-
53
-
54
-
55
-
56
-
57
-
58
-
59
-
60
-
61
-
62
-
63
-
64
-
65
-
66
-
67
-
68
-
69
-
70
-
71
-
72
-
73
-
74
-
75
-
76
-
77
-
78
-
79
-
80
-
81
-
82
-
83
-
84
-
85
-
86
-
87
-
88
-
89
-
90
-
91
-
92
-
93
-
94
-
95
-
96
-
97
-
98
-
99
-
100
-
101
-
102
-
103
-
104
-
105
-
106
-
107
-
108
-
109
-
110
-
111
-
112
-
113
-
114
-
115
-
116
-
117
-
118
-
119
-
120
-
121
-
122
-
123
-
124
-
125
-
126
-
127
-
128
-
129
-
130
 |
 |

28 ROGERS COMMUNICATIONS INC. 2009 ANNUAL REPORT
MANAGEMENT’S DISCUSSION AND ANALYSIS OF FINANCIAL CONDITION AND RESULTS OF OPERATIONS
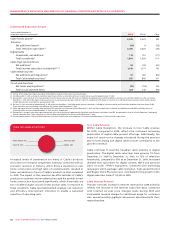
20092008
2007
2008
2007
2009
6,9796,4515,914
1,5151,4911,424
Postpaid Prepaid
WIRELESS POSTPAID AND
PREPAID SUBSCRIBERS
(In thousands)
20092008
2007
2008
2007
2009
$4,416$4,261$3,824
LIFE-TIME REVENUE
PER SUBSCRIBER
20092008
2007
2008
2007
2009
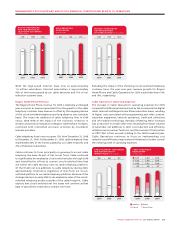
$6,245$5,843$5,154
WIRELESS NETWORK
REVENUE
(In millions of dollars)
20092008
2007
200
8
2007
2009
$1,366$946$683
WIRELESS DATA
REVENUE
(In millions of dollars)
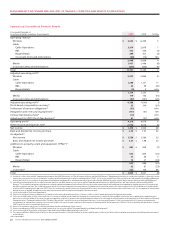
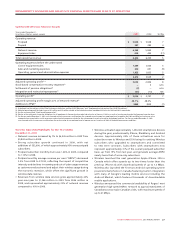
Wireless Subscribers and Network Revenue
The year-over-year decrease in subscriber additions primarily
reflects slower overall market growth, increased competitive
intensity in certain segments of the market, and the unusually high
number of additions during the second half of 2008 following the
Canadian iPhone launch.
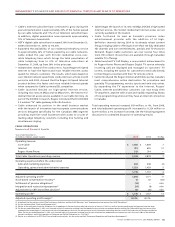
Summarized Wireless Subscriber Results
Years ended December 31,
(Subscriber statistics in thousands, except ARPU, churn and usage) 2009 2008 Chg
Postpaid
Gross additions(1) 1,377 1,341 36
Net additions 528 537 (9)
Total postpaid retail subscribers 6,979 6,451 528
Average monthly revenue per user (“ARPU”)(2) $ 73.93 $ 75.41 $ (1.48)
Average monthly minutes of usage 585 589 (4)
Monthly churn 1.06% 1.10% (0.04%)
Prepaid
Gross additions 582 632 (50)
Net additions 24 67 (43)
Total prepaid retail subscribers 1,515 1,491 24
ARPU(2) $ 16.73 $ 16.65 $ 0.08
Average monthly minutes of usage 121 131 (10)
Monthly churn 3.15% 3.31% (0.16%)
Total Postpaid and Prepaid
Gross additions 1,959 1,973 (14)
Net additions 552 604 (52)
Total postpaid and prepaid retail subscribers 8,494 7,942 552
Monthly churn 1.44% 1.51% (0.07%)
Blended ARPU(2) $ 63.59 $ 64.34 $ (0.75)
Blended average monthly minutes of usage 500 502 (2)
(1) During the third quarter of 2008, an adjustment associated with laptop wireless data card (“data card”) subscribers resulted in the addition of approximately 11,000 subscribers to
Wireless’ postpaid subscriber base. This adjustment is included in gross additions for the year ended December 31, 2008. Beginning in the third quarter of 2008, data cards are included
in the gross additions for postpaid subscribers.
(2) As defined. See the section entitled “Key Performance Indicators and Non-GAAP Measures”. As calculated in the “Supplementary Information: Non-GAAP Calculations” section.
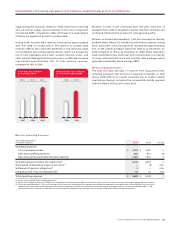
The increase in network revenue in 2009 compared to 2008 was
driven predominantly by the continued growth of Wireless’
postpaid subscriber base and the year-over-year growth of wireless
data. Year-over-year, blended ARPU declined by 1.2%, which
reflects the impact of declines in roaming and out-of-plan usage
revenues as customers curtailed travel and adjusted their wireless