Rogers 2009 Annual Report Download - page 110
Download and view the complete annual report
Please find page 110 of the 2009 Rogers annual report below. You can navigate through the pages in the report by either clicking on the pages listed below, or by using the keyword search tool below to find specific information within the annual report.-
 1
1 -
2
-
3
-
4
-
5
-
6
-
7
-
8
-
9
-
10
-
11
-
12
-
13
-
14
-
15
-
16
-
17
-
18
-
19
-
20
-
21
-
22
-
23
-
24
-
25
-
26
-
27
-
28
-
29
-
30
-
31
-
32
-
33
-
34
-
35
-
36
-
37
-
38
-
39
-
40
-
41
-
42
-
43
-
44
-
45
-
46
-
47
-
48
-
49
-
50
-
51
-
52
-
53
-
54
-
55
-
56
-
57
-
58
-
59
-
60
-
61
-
62
-
63
-
64
-
65
-
66
-
67
-
68
-
69
-
70
-
71
-
72
-
73
-
74
-
75
-
76
-
77
-
78
-
79
-
80
-
81
-
82
-
83
-
84
-
85
-
86
-
87
-
88
-
89
-
90
-
91
-
92
-
93
-
94
-
95
-
96
-
97
-
98
-
99
-
 100
100 -
 101
101 -
 102
102 -
 103
103 -
 104
104 -
 105
105 -
 106
106 -
 107
107 -
 108
108 -
 109
109 -
 110
110 -
 111
111 -
 112
112 -
 113
113 -
 114
114 -
 115
115 -
 116
116 -
 117
117 -
 118
118 -
 119
119 -
 120
120 -
121
-
122
-
123
-
124
-
125
-
126
-
127
-
128
-
129
-
130
 |
 |

114 ROGERS COMMUNICATIONS INC. 2009 ANNUAL REPORT
NOTES TO CONSOLIDATED FINANCIAL STATEMENTS
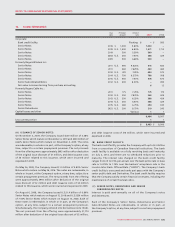
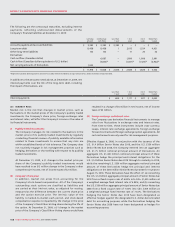
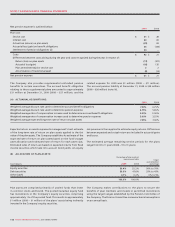
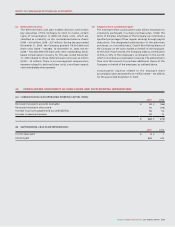
Net pension expense is outlined below:
The Company also provides supplemental unfunded pension
benefits to certain executives. The accrued benefit obligation
relating to these supplemental plans amounted to approximately
$31 million at December 31, 2009 (2008 – $27 million), and the
related expense for 2009 was $3 million (2008 – $11 million).
The accrued pension liability at December 31, 2009 is $29 million
(2008 – $26 million) (note 16).
Expected return on assets represents management’s best estimate
of the long-term rate of return on plan assets applied to the fair
value of the plan assets. The Company establishes its estimate of the
expected rate of return on plan assets based on the fund’s target
asset allocation and estimated rate of return for each asset class.
Estimated rates of return are based on expected returns from fixed
income securities which take into account bond yields. An equity
risk premium is then applied to estimate equity returns. Differences
between expected and actual return are included in actuarial gains
and losses.
The estimated average remaining service periods for the plans
range from 8 to 11 years (2008 – 9 to 13 years).
Plan assets are comprised primarily of pooled funds that invest
in common stocks and bonds. The pooled Canadian equity fund
has investments in the Company’s equity securities comprising
approximately 1% of the pooled fund. This results in approximately
$1 million (2008 – $1 million) of the plans’ assets being indirectly
invested in the Company’s equity securities.
The Company makes contributions to the plans to secure the
benefits of plan members and invests in permitted investments
using the target ranges established by the Pension Committee of
the Company. The Pension Committee reviews actuarial assumptions
on an annual basis.
2009 2008
Plan cost:
Service cost $ 21 $ 28
Interest cost 43 40
Actual loss (return) on plan assets (25) 83
Actuarial loss (gain) on benefit obligations 23 (130)
Settlement of pension obligations (d) 30 –
Costs $ 92 $ 21
Differences between costs arising during the year and costs recognized during the year in respect of:
Return (loss) on plan assets (17) (127)
Actuarial loss (gain) (18) 135
Plan amendments/prior service cost 22
Amortization of transitional asset (8) (10)
Net pension expense $ 51 $ 21
(A) ACTUARIAL ASSUMPTIONS:
2009 2008
Weighted average discount rate used to determine accrued benefit obligations 7.20% 6.75%
Weighted average discount rate used to determine pension expense 6.75% 5.65%
Weighted average rate of compensation increase used to determine accrued benefit obligations 3.00% 3.00%
Weighted average rate of compensation increase used to determine pension expense 3.00% 3.25%
Weighted average expected long-term rate of return on plan assets 7.25% 7.00%
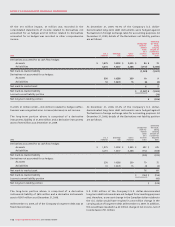
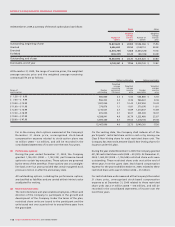
(B) ALLOCATION OF PLAN ASSETS:
Percentage of plan assets at
measurement date Target
asset allocation
percentageAsset category 2009 2008
Equity securities 59.4% 52.2% 50% to 70%
Debt securities 39.9% 47.6% 35% to 45%
Other (cash) 0.7% 0.2% 0% to 5%
100.0% 100.0%