Rogers 2009 Annual Report Download - page 11
Download and view the complete annual report
Please find page 11 of the 2009 Rogers annual report below. You can navigate through the pages in the report by either clicking on the pages listed below, or by using the keyword search tool below to find specific information within the annual report.-
 1
1 -
 2
2 -
 3
3 -
 4
4 -
 5
5 -
 6
6 -
 7
7 -
 8
8 -
 9
9 -
 10
10 -
 11
11 -
 12
12 -
 13
13 -
 14
14 -
 15
15 -
 16
16 -
 17
17 -
 18
18 -
 19
19 -
 20
20 -
 21
21 -
 22
22 -
23
-
24
-
25
-
26
-
27
-
28
-
29
-
30
-
31
-
32
-
33
-
34
-
35
-
36
-
37
-
38
-
39
-
40
-
41
-
42
-
43
-
44
-
45
-
46
-
47
-
48
-
49
-
50
-
51
-
52
-
53
-
54
-
55
-
56
-
57
-
58
-
59
-
60
-
61
-
62
-
63
-
64
-
65
-
66
-
67
-
68
-
69
-
70
-
71
-
72
-
73
-
74
-
75
-
76
-
77
-
78
-
79
-
80
-
81
-
82
-
83
-
84
-
85
-
86
-
87
-
88
-
89
-
90
-
91
-
92
-
93
-
94
-
95
-
96
-
97
-
98
-
99
-
100
-
101
-
102
-
103
-
104
-
105
-
106
-
107
-
108
-
109
-
110
-
111
-
112
-
113
-
114
-
115
-
116
-
117
-
118
-
119
-
120
-
121
-
122
-
123
-
124
-
125
-
126
-
127
-
128
-
129
-
130
 |
 |

14 ROGERS COMMUNICATIONS INC. 2009 ANNUAL REPORT ROGERS COMMUNICATIONS INC. 2009 ANNUAL REPORT 15
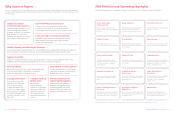
Drove 7% top-line growth in core
Wireless Network and Cable Operations
businesses
Strong Single-Digit
Revenue Growth
Expanded adjusted operating profit
margins 160 basis points despite
economic and competitive pressures
Margin Expansion
Consolidated free cash flow increased
by 29% to $1.9 billion
Free Cash Flow Growth
Annual dividend per share increased
16% in 2009 from $1.00 to $1.16 annually
Dividend Growth
Expanded share buyback program,
repurchasing 43.8 million Rogers shares
for $1.35 billion
Share Buybacks
Issued $2.0 billion of investment grade
long-term notes on favourable terms
Debt Financing
$2.8 billion liquidity with no debt
maturities until mid-2011, and a ratio
of 2.1 times net debt to adjusted
operating profit
Balance Sheet Strength
Grew Wireless Network revenue by 7%
to $6.3 billion and subscribers by 552,000
to 8.5 million
Wireless Growth
Launched North America’s first HSPA+
21 Mbps wireless network and deployed
leading-edge DOCSIS-3.0 50 Mbps
high-speed Internet service
Leading Networks
First in Canada to launch the Apple
iPhone 3GS and Android smartphone
devices
Smartphone Leadership
44% wireless data revenue growth with
data as a percent of network revenue
expanding to 22%.
Double-Digit Wireless
Data Growth
Activated nearly 1.5 million smartphone
customers bringing smartphone
penetration to 31% of postpaid
subscriber base
Higher Value Wireless
Subscribers
Grew high-speed Internet and digital
cable penetration levels to 71% and 72%
of television subscribers, respectively
Internet and Digital Services
Penetration
Enhanced position in SME market with
launch of business-grade telephony and
broadband services
Small Business Segment
Opportunity
Media’s Citytv and OLN television
properties received 29 Gemini nomina-
tions for Canadian programming
Media Awards
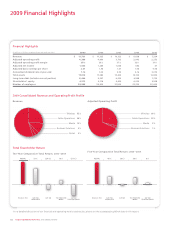
For a detailed discussion of our financial and operating metrics and results, please see the accompanying MD&A later in this report.
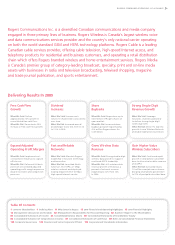
2009 Financial and Operating Highlights
The following represents a sampling of Rogers Communications Inc.’s 2009 performance highlights.
Rogers Communications has excellent positions in growing markets, powerful brands, proven management,
a long record of driving growth and shareholder value, and the financial strength to continue its growth well
into the future.
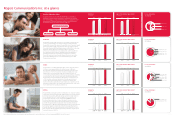
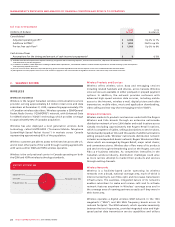
Why invest in Rogers
Leader in Canadian
Communications Industry
Canada’s largest wireless carrier
and a leading cable services
provider, offering a ‘quadruple
play’ of wireless, television,
Internet and telephony services
to consumers and businesses.
Must-Have Products and Services
A leading provider of communications and
entertainment products and services that are
increasingly becoming necessities in today’s world.
Extensive Product Distribution Network
Powerful national product distribution network
consisting of more than 3,600 Rogers-owned,
dealer and retail outlets.
Superior Asset Mix
Majority of revenue and cash flow is generated from wireless and broadband services, the
healthiest and fastest growing segments of the communications industry.
Healthy Liquidity and Meaningful Dividends
RCI common stock actively trades on the TSX and NYSE, with average daily trading volume greater
than two million shares. Each share pays an annualized dividend of $1.28 per share in 2010.
Category-Leading
Media Assets
Unique and
complementary
collection of leading
broadcast radio and
television, specialty
TV, magazine and
sports entertainment
assets.
Proven Leadership and
Operating Management
Experienced, performance-
oriented management and
operating teams with solid
industry expertise, technical
depth and company tenures.
Strong Balance Sheet
Financially strong with
balance sheet leverage
at 2.1 times net debt
to adjusted operating
profit, investment grade
credit ratings, $2.8 billion
of available liquidity and
no debt maturities until
May 2011.
Powerful Brands
Nationally recognized and highly respected brands
that stand strongly in Canada for innovation,
entrepreneurial spirit, choice and value.
Track Record of Value Creation
Proven 30-year public market track
record of long-term index-beating
shareholder value creation.