Rogers 2009 Annual Report Download - page 33
Download and view the complete annual report
Please find page 33 of the 2009 Rogers annual report below. You can navigate through the pages in the report by either clicking on the pages listed below, or by using the keyword search tool below to find specific information within the annual report.-
 1
1 -
2
-
3
-
4
-
5
-
6
-
7
-
8
-
9
-
10
-
11
-
12
-
13
-
14
-
15
-
16
-
17
-
18
-
19
-
20
-
21
-
22
-
 23
23 -
 24
24 -
 25
25 -
 26
26 -
 27
27 -
 28
28 -
 29
29 -
 30
30 -
 31
31 -
 32
32 -
 33
33 -
 34
34 -
 35
35 -
 36
36 -
 37
37 -
 38
38 -
 39
39 -
 40
40 -
 41
41 -
 42
42 -
 43
43 -
44
-
45
-
46
-
47
-
48
-
49
-
50
-
51
-
52
-
53
-
54
-
55
-
56
-
57
-
58
-
59
-
60
-
61
-
62
-
63
-
64
-
65
-
66
-
67
-
68
-
69
-
70
-
71
-
72
-
73
-
74
-
75
-
76
-
77
-
78
-
79
-
80
-
81
-
82
-
83
-
84
-
85
-
86
-
87
-
88
-
89
-
90
-
91
-
92
-
93
-
94
-
95
-
96
-
97
-
98
-
99
-
100
-
101
-
102
-
103
-
104
-
105
-
106
-
107
-
108
-
109
-
110
-
111
-
112
-
113
-
114
-
115
-
116
-
117
-
118
-
119
-
120
-
121
-
122
-
123
-
124
-
125
-
126
-
127
-
128
-
129
-
130
 |
 |
ROGERS COMMUNICATIONS INC. 2009 ANNUAL REPORT 37
MANAGEMENT’S DISCUSSION AND ANALYSIS OF FINANCIAL CONDITION AND RESULTS OF OPERATIONS
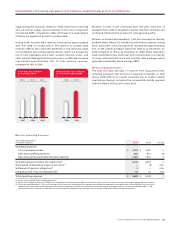
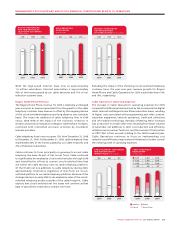
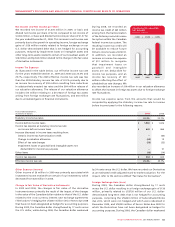
With the high-speed Internet base now at approximately
1.6 million subscribers, Internet penetration is approximately
45% of the homes passed by our cable networks and 71% of our
television customer base.
Rogers Home Phone Revenue
The Rogers Home Phone revenue for 2009 is relatively unchanged
year-over-year as revenue generated from the growth in the cable
telephony customer base revenue is offset by the ongoing decline
of the circuit-switched telephony and long-distance only customer
bases. The lower net additions of cable telephony lines in 2009
versus 2008 reflects the impact of the economic recession in
Ontario and product maturation as Rogers’ market share increases,
combined with intensified win-back activities by incumbent
telecom providers.
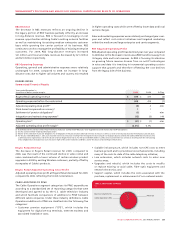
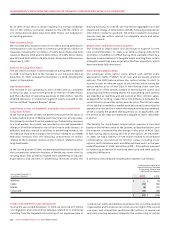
Cable telephony lines in service grew 12% from December 31, 2008
to December 31, 2009. At December 31, 2009, cable telephony lines
represented 26% of the homes passed by our cable networks and
41% of television subscribers.
Cable continues to focus principally on growing its on-net cable
telephony line base. As part of this on-net focus, Cable continued
to significantly de-emphasize circuit-switched sales through 2009
and intensified its efforts to convert circuit-switched lines that
are within the cable territory onto its cable telephony platform.
Of the 97,000 net line additions to cable telephony during 2009,
approximately 17,000 were migrations of lines from our circuit-
switched platform to our cable telephony platform. Because of the
strategic decision in early 2008 to de-emphasize sales of the circuit-
switched telephony product outside of the cable footprint, Cable
expects that circuit-switched net line losses will continue as that
base of subscribers continues to contract over time.
Excluding the impact of the shrinking circuit-switched telephony
customer base, the year-over-year revenue growth for Rogers
Home Phone and Cable Operations for 2009 would have been 19%
and 10%, respectively.
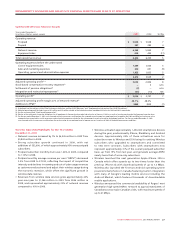
Cable Operations Operating Expenses
The increase in Cable Operations’ operating expenses for 2009
compared to 2008 was primarily driven by the increases in the digital
cable, Internet and Rogers Home Phone subscriber bases, resulting
in higher costs associated with programming and other content,
subscriber equipment, network operations, credit and collections
and information technology. Partially offsetting these increases
was a reduction in certain other costs resulting from lower volumes
of subscriber net additions in 2009, cost reduction and efficiency
initiatives across various functions, and the reversal of that portion
of CRTC Part II fees accruals relating to the 2009 broadcast year.
Cable Operations continues to focus on implementing cost
reduction and efficiency improvement initiatives to further control
the overall growth in operating expenses.
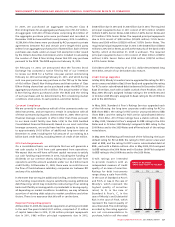
20092008
2007
2008
2007
2009
1,664
72%
67%
59%
1,5501,353
DIGITAL HOUSEHOLDS
AND PENETRATION OF
TELEVISION CUSTOMERS
(In thousands)
20092008
2007
2008
2007
2009
715568361
HIGH-DEFINITION
HOUSEHOLDS
(In thousands)
20092008
2007
2008
2007
2009
1,619
45%
44%
41%
1,5711,451
INTERNET SUBSCRIBERS
AND PENETRATION
OF HOMES PASSED (In thousands)
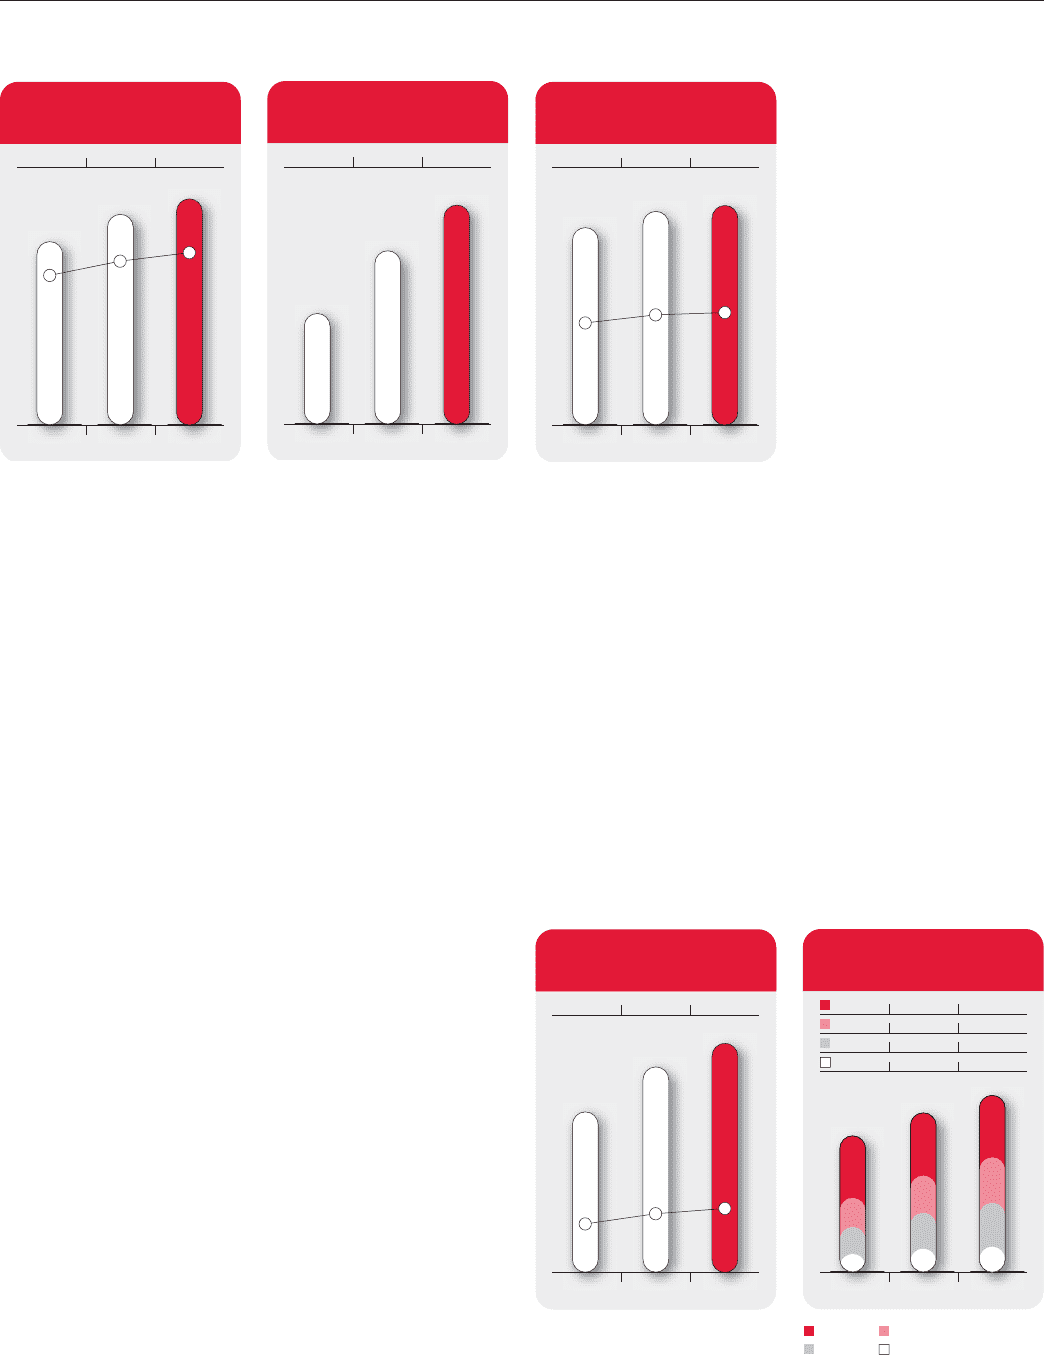
20092008
2007
2008
2007
2009
937
26%
24%
18%
840656
CABLE TELEPHONY SUBSCRIBERS
AND PENETRATION OF
HOMES PASSED (In thousands)
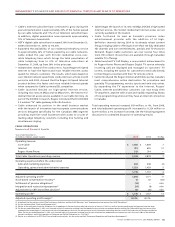
20092008
2007
2008
2007
2009
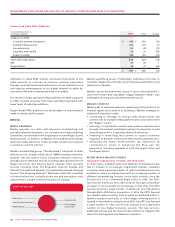
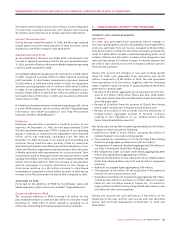
1,6641,5501,353
1,6191,5711,451
937840656
2,2962,3202,295
Television Digital
Internet Home Phone
CABLE SUBSCRIBER
BREAKDOWN
(In thousands)