Rogers 2009 Annual Report Download - page 39
Download and view the complete annual report
Please find page 39 of the 2009 Rogers annual report below. You can navigate through the pages in the report by either clicking on the pages listed below, or by using the keyword search tool below to find specific information within the annual report.-
 1
1 -
2
-
3
-
4
-
5
-
6
-
7
-
8
-
9
-
10
-
11
-
12
-
13
-
14
-
15
-
16
-
17
-
18
-
19
-
20
-
21
-
22
-
23
-
24
-
25
-
26
-
27
-
28
-
 29
29 -
 30
30 -
 31
31 -
 32
32 -
 33
33 -
 34
34 -
 35
35 -
 36
36 -
 37
37 -
 38
38 -
 39
39 -
 40
40 -
 41
41 -
 42
42 -
 43
43 -
 44
44 -
 45
45 -
 46
46 -
 47
47 -
 48
48 -
 49
49 -
50
-
51
-
52
-
53
-
54
-
55
-
56
-
57
-
58
-
59
-
60
-
61
-
62
-
63
-
64
-
65
-
66
-
67
-
68
-
69
-
70
-
71
-
72
-
73
-
74
-
75
-
76
-
77
-
78
-
79
-
80
-
81
-
82
-
83
-
84
-
85
-
86
-
87
-
88
-
89
-
90
-
91
-
92
-
93
-
94
-
95
-
96
-
97
-
98
-
99
-
100
-
101
-
102
-
103
-
104
-
105
-
106
-
107
-
108
-
109
-
110
-
111
-
112
-
113
-
114
-
115
-
116
-
117
-
118
-
119
-
120
-
121
-
122
-
123
-
124
-
125
-
126
-
127
-
128
-
129
-
130
 |
 |

ROGERS COMMUNICATIONS INC. 2009 ANNUAL REPORT 43
MANAGEMENT’S DISCUSSION AND ANALYSIS OF FINANCIAL CONDITION AND RESULTS OF OPERATIONS
Net Income and Net Income per Share
We recorded net income of $1,478 million in 2009, or basic and
diluted net income per share of $2.38, compared to net income of
$1,002 million, or basic and diluted net income per share of $1.57 for
the year ended December 31, 2008. This increase in net income was
primarily due to the growth in operating income, foreign exchange
gains of $136 million mainly related to foreign exchange on our
U.S. dollar-denominated debt that is not hedged for accounting
purposes, reduced by impairment losses on intangible assets and
other long-term assets related to certain of our broadcast assets of
$18 million and by $65 million related to the change in the fair value
of derivative instruments.
Income Tax Expense
As illustrated in the table below, our effective income tax rate
for the years ended December 31, 2009 and 2008 was 25.4% and
29.7%, respectively. The 2009 effective income tax rate was less
than the 2009 statutory income tax rate of 32.3% primarily due to
an income tax recovery of $58 million resulting from reductions
in substantively enacted tax rates and the $64 million release of
our valuation allowance. The release of our valuation allowance
includes $14 million relating to a decrease of foreign tax assets
arising from foreign exchange rate fluctuations, and $50 million
due to unrealized gains on financial instruments.
Other Expense (Income)
Other income of $6 million in 2009 was primarily associated with
investment income received from certain of our investments, which
decreased from $28 million in 2008.
Change in Fair Value of Derivative Instruments
In 2009 and 2008, the changes in fair value of the derivative
instruments were primarily the result of the impact of the changes
in the value of the Canadian dollar relative to that of the U.S. dollar
related to the cross-currency interest rate exchange agreements
(“Derivatives”) hedging the US$350 million Senior Notes due 2038
that have not been designated as hedges for accounting purposes.
During 2009, the Canadian dollar strengthened by 17 cents versus
the U.S. dollar, while during 2008, the Canadian dollar weakened
by 24 cents versus the U.S. dollar. We have recorded our Derivatives
at an estimated credit-adjusted mark-to-market valuation. For the
impact, refer to the section entitled “Fair Value for Derivatives”.
Foreign Exchange Gain (Loss)
During 2009, the Canadian dollar strengthened by 17 cents
versus the U.S. dollar resulting in a foreign exchange gain of $136
million, primarily related to US$750 million of our U.S. dollar-
denominated long-term debt that is not hedged for accounting
purposes, comprising the US$400 million of Subordinated Notes
due 2012, which were not hedged and which were redeemed in
December 2009, and US$350 million of Senior Notes due 2038 for
which the Derivatives have not been designated as hedges for
accounting purposes. During 2008, the Canadian dollar weakened
During 2008, we recorded an
income tax credit of $65 million
arising from the harmonization
of the Ontario provincial income
tax system within the Canadian
federal income tax system. The
resulting income tax credit will
be available to reduce future
Ontario income taxes until 2013.
In addition, we recorded an
increase in income tax expense
of $51 million to recognize
that impairment losses on
go o d w ill an d in t an g i b le
assets are not deductible for
income tax purposes, and an
income tax recovery of $33
million reflecting the effect of
scheduled tax rate changes. We
also recorded an increase of $19 million in our valuation allowance
to offset the increase in foreign tax assets due to foreign exchange
rate fluctuations.
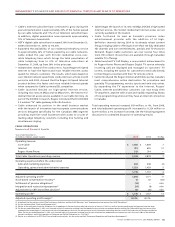
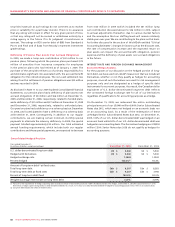
Income tax expense varies from the amounts that would be
computed by applying the statutory income tax rate to income
before income taxes for the following reasons:
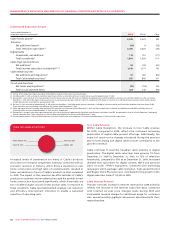
20092008
2007
2008
2007
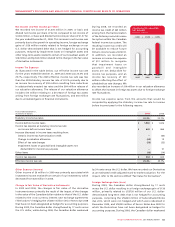
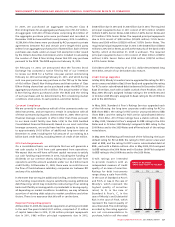
2009
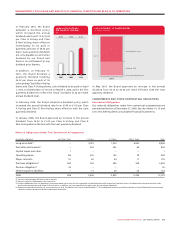
$1,556$1,260$1,066
CONSOLIDATED ADJUSTED
NET INCOME
(In millions of dollars)
Years ended December 31,
(In millions of dollars) 2009 2008
Statutory income tax rates 32.3% 32.7%
Income before income taxes $ 1,980 $ 1,426
Income tax expense at statutory income tax rate
on income before income taxes $ 640 $ 466
Increase (decrease) in income taxes resulting from:
Ontario income tax harmonization credit – (65)
Change in valuation allowance (64) 19
Effect of tax rate changes (58) (33)
Impairment losses on goodwill and intangible assets not
deductible for income tax purposes – 51
Other items (16) (14)
Income tax expense $ 502 $ 424
Effective income tax rate 25.4% 29.7%