Rogers 2009 Annual Report Download - page 41
Download and view the complete annual report
Please find page 41 of the 2009 Rogers annual report below. You can navigate through the pages in the report by either clicking on the pages listed below, or by using the keyword search tool below to find specific information within the annual report.-
 1
1 -
2
-
3
-
4
-
5
-
6
-
7
-
8
-
9
-
10
-
11
-
12
-
13
-
14
-
15
-
16
-
17
-
18
-
19
-
20
-
21
-
22
-
23
-
24
-
25
-
26
-
27
-
28
-
29
-
30
-
 31
31 -
 32
32 -
 33
33 -
 34
34 -
 35
35 -
 36
36 -
 37
37 -
 38
38 -
 39
39 -
 40
40 -
 41
41 -
 42
42 -
 43
43 -
 44
44 -
 45
45 -
 46
46 -
 47
47 -
 48
48 -
 49
49 -
 50
50 -
 51
51 -
52
-
53
-
54
-
55
-
56
-
57
-
58
-
59
-
60
-
61
-
62
-
63
-
64
-
65
-
66
-
67
-
68
-
69
-
70
-
71
-
72
-
73
-
74
-
75
-
76
-
77
-
78
-
79
-
80
-
81
-
82
-
83
-
84
-
85
-
86
-
87
-
88
-
89
-
90
-
91
-
92
-
93
-
94
-
95
-
96
-
97
-
98
-
99
-
100
-
101
-
102
-
103
-
104
-
105
-
106
-
107
-
108
-
109
-
110
-
111
-
112
-
113
-
114
-
115
-
116
-
117
-
118
-
119
-
120
-
121
-
122
-
123
-
124
-
125
-
126
-
127
-
128
-
129
-
130
 |
 |

ROGERS COMMUNICATIONS INC. 2009 ANNUAL REPORT 45
MANAGEMENT’S DISCUSSION AND ANALYSIS OF FINANCIAL CONDITION AND RESULTS OF OPERATIONS
information technology functions ($23 million); iii) the integration
of previously acquired businesses and related restructuring
($3 million); and iv) the closure of certain retail stores ($4 million).
Contract Termination Fees
During the year ended December 31, 2009, the Blue Jays released
certain players from the remaining term of their contracts, which
resulted in a $19 million charge to operating profit.
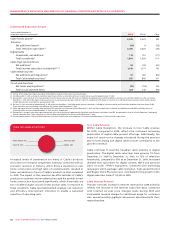
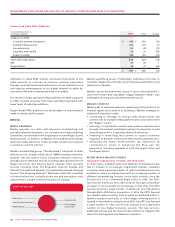
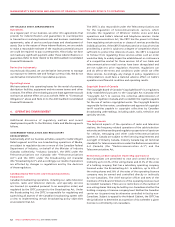
Adjusted Operating Profit
As discussed above, Wireless and Cable both contributed to the
increase in adjusted operating profit for the year ended December
31, 2009, partially offset by a decrease in Media’s adjusted operating
profit for 2009 compared to 2008.
Consolidated adjusted operating profit increased to $4,388 million
in 2009, compared to $4,060 million in 2008. Adjusted operating
profit excludes: (i) stock-based compensation (recovery) expense
of $(33) million in 2009 and $(100) million in 2008; (ii) integration
and restructuring expenses of $117 million in 2009 and $51 million
in 2008; (iii) an adjustment for CRTC Part II fees related to prior
periods of $(61) million in 2009 and $31 million in 2008; (iv) contract
termination fees of $19 million in 2009; and (v) pension settlement
of $30 million in 2009.
For details on the determination of adjusted operating profit, which
is a non-GAAP measure, see the sections entitled “Supplementary
Information: Non-GAAP Calculations” and “Key Performance
Indicators and Non-GAAP Measures”.
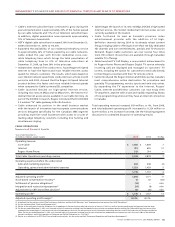
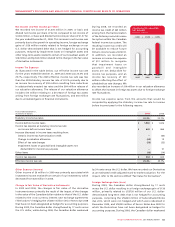
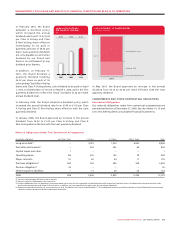
Employees
Employee remuneration represents a material portion of our
expenses. At December 31, 2009, we had approximately 25,900
full-time equivalent employees (“FTEs”) across all of our operating
groups, including our shared services organization and corporate
office, which was essentially unchanged from the level at
December 31, 2008. Increases in our shared services staffing and
customer facing functions were partially offset by reductions
associated with operational efficiencies and the integration of our
Cable and Wireless organizations during the year and reductions
in Media associated with improvements to its cost structure. Total
remuneration paid to employees (both full and part-time) in 2009
was approximately $1,715 million, an increase of approximately $149
million from $1,566 million in 2008. The increase in remuneration
paid to employees is primarily attributed to the change in
stock prices resulting in a $33 million recovery to stock-based
compensation compared to a $100 million recovery in 2008 and an
increase in the FTEs during the first half of 2009 compared to 2008.
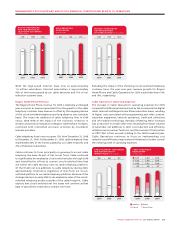
ADDITIONS TO PP&E
For details on the additions of PP&E for the Wireless, Cable and
Media segments, refer to the section entitled “Segment Review”.
Corporate Additions to PP&E
The corporate additions to PP&E included $151 million for the
year ended December 31, 2009 and $38 million for the year ended
December 31, 2008, both of which related to spending on an
enterprise-wide billing and business support system initiative.
3. CONSOLIDATED LIQUIDITY AND FINANCING
LIQUIDITY AND CAPITAL RESOURCES
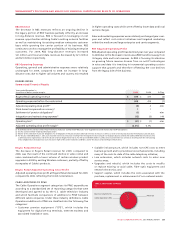
Operations
For 2009, cash generated from operations before changes in
non-cash operating items, which is calculated by removing the effect
of all non-cash items from net income, increased to $3,526 million
from $3,500 million in 2008. The $26 million increase is primarily the
result of a $328 million increase in adjusted operating profit, most
notably offset by the $66 million increase in the integration and
restructuring charge, $72 million increase in interest expense and
$61 million cash contribution to the Company’s pension plans to
fund annuity purchases.
Taking into account the changes in non-cash working capital
items for 2009, cash generated from operations was $3,790
million, compared to $3,285 million in 2008. The cash generated
from operations of $3,790 million, together with the following
items, resulted in total net funds of approximately $5,795 million
generated or raised in 2009:
• Receipt of $2.0 billion aggregate gross proceeds from the issu-
ance of $1.0 billion 5.80% Senior Notes due 2016, $500 million
5.38% Senior Notes due 2019 and $500 million 6.68% Senior Notes
due 2039 public debt;
• Receipt of $3 million from the issuance of Class B Non-Voting
shares under the exercise of employee stock options; and
• Receipt of $2 million in net proceeds from the settlement of
US$408 million aggregate amount of forward contracts
relating to the redemption of our US$400 million 8.00%
Senior Subordinated Notes due 2012.
Net funds used during 2009 totalled approximately $5,393 million,
the details of which include the following:
• Additions to PP&E of $1,910 million, including $55 million of
related changes in non-cash working capital;
• The purchase for cancellation of 43,776,200 Class B Non-Voting
shares for an aggregate purchase price of $1,347 million;
• The payment of quarterly dividends aggregating $704 million on
our Class A Voting and Class B Non-Voting shares;
• Net repayments under our bank credit facility aggregating $585
million and capital leases aggregating $1 million;
• Payment of $424 million for the redemption of our US$400 million
8.00% Subordinated Notes due 2012 and $8 million repayment
premium;
• Additions to program rights aggregating $185 million;
• The payment of $40 million for the acquisition of the spectrum
licences of Look Communications; and
• Acquisitions and other net investments aggregating $189 million,
including $163 million to purchase 3.2 million shares of Cogeco
Cable Inc. and 1.6 million shares of Cogeco Inc., $11 million to
acquire K-Rock and KIX Country, Kingston FM radio stations, and
$15 million of other net investments.
Taking into account the cash deficiency of $19 million at the
beginning of the year and the cash sources and uses described
above, cash and cash equivalents at December 31, 2009 was
$383 million.