Rogers 2009 Annual Report Download - page 75
Download and view the complete annual report
Please find page 75 of the 2009 Rogers annual report below. You can navigate through the pages in the report by either clicking on the pages listed below, or by using the keyword search tool below to find specific information within the annual report.-
 1
1 -
2
-
3
-
4
-
5
-
6
-
7
-
8
-
9
-
10
-
11
-
12
-
13
-
14
-
15
-
16
-
17
-
18
-
19
-
20
-
21
-
22
-
23
-
24
-
25
-
26
-
27
-
28
-
29
-
30
-
31
-
32
-
33
-
34
-
35
-
36
-
37
-
38
-
39
-
40
-
41
-
42
-
43
-
44
-
45
-
46
-
47
-
48
-
49
-
50
-
51
-
52
-
53
-
54
-
55
-
56
-
57
-
58
-
59
-
60
-
61
-
62
-
63
-
64
-
 65
65 -
 66
66 -
 67
67 -
 68
68 -
 69
69 -
 70
70 -
 71
71 -
 72
72 -
 73
73 -
 74
74 -
 75
75 -
 76
76 -
 77
77 -
 78
78 -
 79
79 -
 80
80 -
 81
81 -
 82
82 -
 83
83 -
 84
84 -
 85
85 -
86
-
87
-
88
-
89
-
90
-
91
-
92
-
93
-
94
-
95
-
96
-
97
-
98
-
99
-
100
-
101
-
102
-
103
-
104
-
105
-
106
-
107
-
108
-
109
-
110
-
111
-
112
-
113
-
114
-
115
-
116
-
117
-
118
-
119
-
120
-
121
-
122
-
123
-
124
-
125
-
126
-
127
-
128
-
129
-
130
 |
 |

ROGERS COMMUNICATIONS INC. 2009 ANNUAL REPORT 79
MANAGEMENT’S DISCUSSION AND ANALYSIS OF FINANCIAL CONDITION AND RESULTS OF OPERATIONS
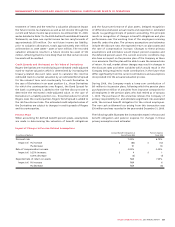
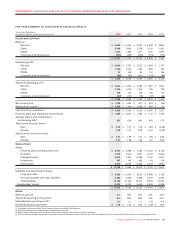
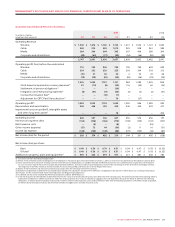
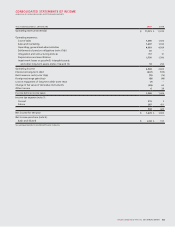
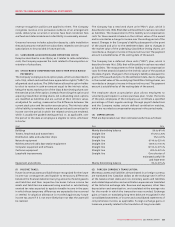
RCI(1)(2)(3)(4) Guarantors(1)(2)(3)(4) Other Subsidiaries (2)(3)(4)
In millions of dollars (unaudited)
Years ended December 31 (unaudited)
Dec.31
2009 Dec. 31
2008
Dec. 31
2007
Dec.31
2009 Dec. 31
2008
Dec. 31
2007
Dec.31
2009 Dec. 31
2008
Dec. 31
2007
Statement of Income Data:
Revenue $ 90 $ 83 $ 75 $ 8,884 $ 8,469 $ 7,461 $ 3,159 $ 3,186 $ 2,934
Operating Income (loss) (133) (131) (352) 2,270 2,145 1,612 580 260 456
Net income (loss) 1,478 1,002 637 2,153 1,814 1,479 (498) (293) 16
Balance Sheet Data
(at period end):
Current assets $ 3,339 $ 3,011 $ 3,622 $ 5,296 $ 3,253 $ 3,669 $ 3,349 $ 2,097 $ 2,356
Non-current assets 21,681 17,406 14,337 8,366 7,105 6,830 8,328 7,689 5,159
Current liabilities 7,724 4,190 3,321 4,005 3,903 5,885 748 691 1,047
Non-current liabilities 9,489 9,134 7,651 147 149 170 81 132 17
Consolidating Adjustments (2)(3)(4) Total Consolidated Amounts
In millions of dollars (unaudited)
Years ended December 31 (unaudited)
Dec.31
2009 Dec. 31
2008
Dec. 31
2007
Dec.31
2009 Dec. 31
2008
Dec. 31
2007
Statement of Income Data:
Revenue $ (402) $ (403) $ (347) $ 11,731 $ 11,335 $ 10,123
Operating Income (loss) (149) (250) (220) 2,568 2,024 1,496
Net income (loss) (1,655) (1,521) (1,495) 1,478 1,002 637
Balance Sheet Data
(at period end):
Current assets $ (9,729) $ (6,065) $ (7,499) $ 2,255 $ 2,296 $ 2,148
Non-current assets (23,612) (17,414) (13,160) 14,763 14,786 13,166
Current liabilities (9,729) (6,068) (7,511) 2,748 2,716 2,742
Non-current liabilities 280 235 121 9,997 9,650 7,959
Management’s Report on Internal Control
Over Financial Reporting
The management of our company is responsible for establishing and
maintaining adequate internal controls over financial reporting.
Our internal control system was designed to provide reasonable
assurance to our management and Board of Directors regarding the
preparation and fair presentation of published financial statements
in accordance with generally accepted accounting principles.
All internal control systems, no matter how well designed, have
inherent limitations. Therefore, even those systems determined to
be effective can provide only reasonable assurance with respect to
financial statement preparation and presentation.
CONTROLS AND PROCEDURES
Disclosure Controls and Procedures
As of the end of the period covered by this report (the “Evaluation
Date”), we conducted an evaluation (under the supervision and
with the participation of our management, including the Chief
Executive Officer and Chief Financial Officer), pursuant to Rule
13a-15 promulgated under the Securities Exchange Act of 1934, as
amended (the “Exchange Act”), of the effectiveness of the design
and operation of our disclosure controls and procedures. Based
on this evaluation, our Chief Executive Officer and Chief Financial
Officer concluded that as of the Evaluation Date such disclosure
controls and procedures were effective.
(1) All information contained in the foregoing table is presented as if the intracompany amalgamation of RCI and certain of its wholly-owned subsidiaries, including Rogers Cable Inc. and
Rogers Wireless Inc., that occurred on July 1, 2007, as well as the provision of the RWP and RCCI guarantees in respect of our bank debt, our public debt and our Derivatives, had occurred
at the start of the earliest period presented (ie. January 1, 2007).
(2) For the purposes of this table, investments in subsidiary companies are accounted for by the equity method.
(3) Amounts recorded in current liabilities and non-current liabilities for the guarantors do not include any obligations arising as a result of being a guarantor or co-obligor, as the case may be,
under any of RCI’s long-term debt.
(4) On January 1, 2009, we adopted CICA Handbook section 3064, Goodwill and Intangible Assets. The adoption was applied retrospectively with restatement of prior periods and resulted in a
$5 million increase in current assets, a $16 million decrease in non-current assets, and an $11 million decrease in retained earnings for the periods presented above prior to January 1, 2009
and had no material impact on previously reported net income for those periods.