Rogers 2009 Annual Report Download - page 32
Download and view the complete annual report
Please find page 32 of the 2009 Rogers annual report below. You can navigate through the pages in the report by either clicking on the pages listed below, or by using the keyword search tool below to find specific information within the annual report.-
 1
1 -
2
-
3
-
4
-
5
-
6
-
7
-
8
-
9
-
10
-
11
-
12
-
13
-
14
-
15
-
16
-
17
-
18
-
19
-
20
-
21
-
 22
22 -
 23
23 -
 24
24 -
 25
25 -
 26
26 -
 27
27 -
 28
28 -
 29
29 -
 30
30 -
 31
31 -
 32
32 -
 33
33 -
 34
34 -
 35
35 -
 36
36 -
 37
37 -
 38
38 -
 39
39 -
 40
40 -
 41
41 -
 42
42 -
43
-
44
-
45
-
46
-
47
-
48
-
49
-
50
-
51
-
52
-
53
-
54
-
55
-
56
-
57
-
58
-
59
-
60
-
61
-
62
-
63
-
64
-
65
-
66
-
67
-
68
-
69
-
70
-
71
-
72
-
73
-
74
-
75
-
76
-
77
-
78
-
79
-
80
-
81
-
82
-
83
-
84
-
85
-
86
-
87
-
88
-
89
-
90
-
91
-
92
-
93
-
94
-
95
-
96
-
97
-
98
-
99
-
100
-
101
-
102
-
103
-
104
-
105
-
106
-
107
-
108
-
109
-
110
-
111
-
112
-
113
-
114
-
115
-
116
-
117
-
118
-
119
-
120
-
121
-
122
-
123
-
124
-
125
-
126
-
127
-
128
-
129
-
130
 |
 |

36 ROGERS COMMUNICATIONS INC. 2009 ANNUAL REPORT
MANAGEMENT’S DISCUSSION AND ANALYSIS OF FINANCIAL CONDITION AND RESULTS OF OPERATIONS
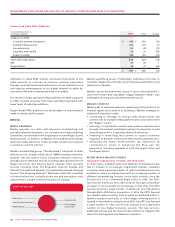
Increased levels of penetration for many of Cable’s products
and a level of increased competitive intensity, combined with an
economic recession in Ontario, which drove a slowdown in new
home construction and high rates of unemployment, resulted in
lower net additions of most of Cable’s products in 2009, compared
to 2008. The impact of this recession has affected sales of Cable’s
products as customers move residences less and the growth in new
home construction has slowed significantly, which historically are
two of Cable’s largest sources of new product sales. In response to
these conditions, Cable has implemented strategic cost reduction
and efficiency improvement initiatives to enable a sustained
reduction of operating costs.
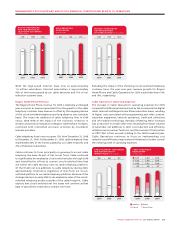
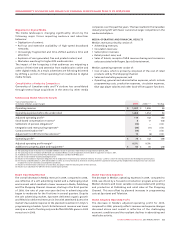
Core Cable Revenue
Within Cable Operations, the increase in Core Cable revenue
for 2009, compared to 2008, reflects the continued increasing
penetration of digital cable product offerings. Additionally, the
impact of certain price changes introduced during the previous
year to both analog and digital cable services contributed to the
growth in revenue.
Cable continues to lead the Canadian cable industry in digital
penetration. The digital cable subscriber base grew by 7% from
December 31, 2008 to December 31, 2009, to 72% of television
households, compared to 67% as at December 31, 2008. Increased
demand from subscribers for digital content, HDTV and personal
video recorder (“PVR”) equipment, combined with marketing
campaigns which package cable television, high-speed Internet
and Rogers Home Phone services, contributed to the growth in the
digital subscriber base of 114,000 in 2009.
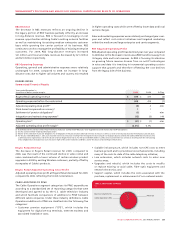
Cable Internet Revenue
The year-over-year increase in Internet revenues for 2009 primarily
reflects the increase in the Internet subscriber base, combined
with Internet services price changes made during 2009 and
incremental revenue charges for additional usage for customers
who exceed monthly gigabyte allowances associated with their
respective plans.
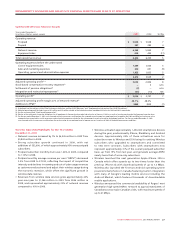
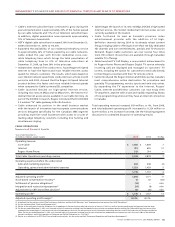
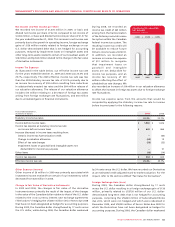
Summarized Subscriber Results
Years ended December 31,
(Subscriber statistics in thousands) 2009 2008(1) Chg
Cable homes passed(2) 3,635 3,547 88
Television
Net additions (losses)(3) (24) 9 (33)
Total Television subscribers(4) 2,296 2,320 (24)
Digital Cable
Households, net additions 114 191 (77)
Total households(4) 1,664 1,550 114
Cable High-speed Internet
Net additions(5) 48 109 (61)
Total Internet subscribers (residential)(4)(5)(6) 1,619 1,571 48
Cable telephony lines
Net additions and migrations(7) 97 182 (85)
Total Cable telephony lines(4) 937 840 97
Circuit-switched lines
Net losses and migrations(7) (91) (119) 28
Total circuit-switched items 124 215 (91)
(1) Certain of the comparative figures have been reclassified to conform to the current year presentation.
(2) Since December 31, 2008, a change in subscriber reporting resulted in a cumulative decrease to cable homes passed of approximately 171,000.
(3) During 2008, a reclassification of certain subscribers had the impact of increasing television net additions by approximately 16,000. In addition, television net subscriber additions for the year ended
December 31, 2008 reflect the impact of the conversion of a large municipal housing authority’s cable TV arrangement with Rogers from a bulk to an individual tenant pay basis, which had the impact
of reducing television subscribers by approximately 5,000.
(4) On June 12, 2008, we acquired approximately 16,000 television subscribers, 11,000 high-speed Internet subscribers, 6,000 digital cable households and 2,000 cable telephony lines from Aurora Cable.
These subscribers are not included in net additions for the year ended December 31, 2008.
(5) Cable high-speed Internet subscriber base excludes ADSL subscribers of 5,000 and 10,000 at December 31, 2009 and 2008, respectively. In addition, net additions exclude ADSL subscriber losses of
6,000 and 3,000 in the years ended December 31, 2009 and 2008, respectively.
(6) During 2008, a change in subscriber reporting resulted in the reclassification of approximately 4,000 high-speed Internet subscribers from RBS’ broadband data circuits to Cable Operations’ high-speed
Internet subscriber base. These subscribers are not included in net additions for the year ended December 31, 2008.
(7) Includes approximately 17,000 and 60,000 migrations from circuit-switched to cable telephony for the years ended December 31, 2009 and 2008, respectively.
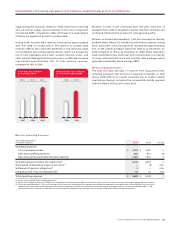
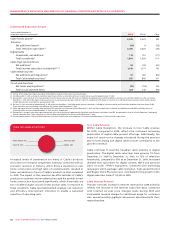
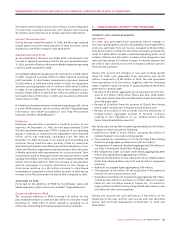
Home Phone 14%
Internet 25%
Television 35%
Digital 26%
CABLE SUBSCRIBER BREAKDOWN
(%)