Rogers 2009 Annual Report Download - page 19
Download and view the complete annual report
Please find page 19 of the 2009 Rogers annual report below. You can navigate through the pages in the report by either clicking on the pages listed below, or by using the keyword search tool below to find specific information within the annual report.-
 1
1 -
2
-
3
-
4
-
5
-
6
-
7
-
8
-
 9
9 -
 10
10 -
 11
11 -
 12
12 -
 13
13 -
 14
14 -
 15
15 -
 16
16 -
 17
17 -
 18
18 -
 19
19 -
 20
20 -
 21
21 -
 22
22 -
 23
23 -
 24
24 -
 25
25 -
 26
26 -
 27
27 -
 28
28 -
 29
29 -
30
-
31
-
32
-
33
-
34
-
35
-
36
-
37
-
38
-
39
-
40
-
41
-
42
-
43
-
44
-
45
-
46
-
47
-
48
-
49
-
50
-
51
-
52
-
53
-
54
-
55
-
56
-
57
-
58
-
59
-
60
-
61
-
62
-
63
-
64
-
65
-
66
-
67
-
68
-
69
-
70
-
71
-
72
-
73
-
74
-
75
-
76
-
77
-
78
-
79
-
80
-
81
-
82
-
83
-
84
-
85
-
86
-
87
-
88
-
89
-
90
-
91
-
92
-
93
-
94
-
95
-
96
-
97
-
98
-
99
-
100
-
101
-
102
-
103
-
104
-
105
-
106
-
107
-
108
-
109
-
110
-
111
-
112
-
113
-
114
-
115
-
116
-
117
-
118
-
119
-
120
-
121
-
122
-
123
-
124
-
125
-
126
-
127
-
128
-
129
-
130
 |
 |

ROGERS COMMUNICATIONS INC. 2009 ANNUAL REPORT 23
MANAGEMENT’S DISCUSSION AND ANALYSIS OF FINANCIAL CONDITION AND RESULTS OF OPERATIONS
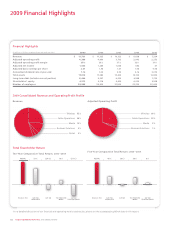
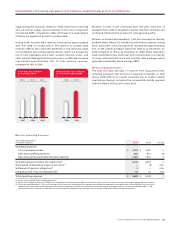
Our consolidated revenue was $11,731 million in 2009, an increase
of $396 million, or 3%, from $11,335 million in 2008. Of the increase,
Wireless contributed $319 million, Cable contributed $139 million,
a decrease in corporate items and eliminations contributed
$27 million and these were offset by a decrease in Media of
$89 million.
Our consolidated adjusted operating profit was $4,388 million, an
increase of $328 million, or 8%, from $4,060 million in 2008. Of this
increase, Wireless contributed $236 million, Cable contributed $91
million, a decrease in corporate items and eliminations contributed
$24 million and these were offset by a decrease in Media of $23
million. On a consolidated basis, we recorded net income of $1,478
million for the year ended December 31, 2009, compared to net
income of $1,002 million in 2008, and we generated free cash flow
of $1,886 million, up 29% from 2008.
Refer to the respective individual segment discussions for details of
the revenue, operating expenses, operating profit and additions to
PP&E of Wireless, Cable and Media.
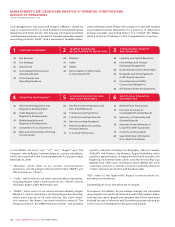
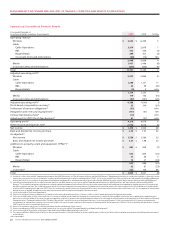
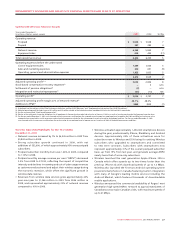
2009 Performance Against Targets
The following table sets forth the guidance ranges for selected
full-year financial and operating metrics that we provided for 2009,
as revised during the year, versus the actual results we achieved for
the year. Certain of the measures included below are not defined
under Canadian GAAP.
Our actual 2009 consolidated revenue, adjusted operating profit
and PP&E expenditures were within the updated guidance ranges
provided. Free cash flow and adjusted operating profit at Cable
Operations and Media exceeded the guidance ranges provided
resulting from cost containment initiatives, as well as better than
expected fourth quarter advertising revenues in Media.
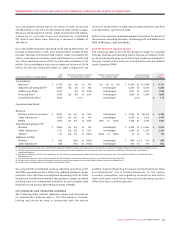
2010 FINANCIAL AND OPERATING GUIDANCE
The following table outlines guidance ranges and assumptions
for selected 2010 financial metrics. This information is forward-
looking and should be read in conjunction with the section
entitled “Caution Regarding Forward-Looking Statements, Risks
and Assumptions” and in related disclosures, for the various
economic, competitive, and regulatory assumptions and factors
that could cause actual future financial and operating results to
differ from those currently expected.
(1) Consolidated revenue includes revenue from Wireless equipment, RBS, Rogers Retail and Corporate items and eliminations in addition to Wireless Network, Cable Operations and Media revenue.
(2) Excludes stock-based compensation expense (recovery), integration and restructuring expenses, contract termination fees, adjustment for CRTC Part II fees decision, and settlement
of pension obligations.
(3) Consolidated additions to PP&E include expenditures related to billing system development, Rogers Media and corporately owned real estate in addition to Wireless and Cable Operations
PP&E expenditures.
(4) Free cash flow is defined as adjusted operating profit less PP&E expenditures and interest expense and is not a term defined under Canadian GAAP.
(5) Includes cable television, residential high-speed Internet and residential telephony services; excludes Rogers Business Solutions and Rogers Retail.
(6) Includes losses from Rogers Sports Entertainment of $20 million in 2009.
(In millions of dollars, except dividend)
2008
Actual
2009 Original Guidance Range %
(As at February 18, 2009)
Updated Guidance Range %
(As at July 28, 2009)
Guidance Range $
(As at July 28, 2009)
2009
Actual
Consolidated
Revenue(1) $ 11,335 Up 5% to 9% Up 2% to 4% $ 11,562 to $ 11,788 $ 11,731
Adjusted operating profit(2) 4,060 Up 3% to 8% Unchanged 4,200 to 4,400 4,388
Additions to PP&E(3) 2,021 0% to (10%) Unchanged 1,821 to 2,021 1,855
Free cash flow(4) 1,464 Up 9% to 23% Unchanged 1,600 to 1,800 1,886
Annualized dividend $1.00 $1.16 Unchanged $1.16 $ 1.16
Supplementary Detail:
Revenue
Wireless (network revenue) $ 5,843 Up 6% to 10% Unchanged $ 6,195 to $6,425 $ 6,245
Cable Operations(5) 2,878 Up 6% to 8% Unchanged 3,050 to 3,120 3,074
Media 1,496 Up 4% to (6%) (4%) to (10%) 1,346 to 1,436 1,407
Adjusted operating profit(2)
Wireless $ 2,806 Up 5% to 9% Unchanged $ 2,945 to $ 3,060 $ 3,042
Cable Operations(5) 1,171 Up 6% to 10% Unchanged 1,240 to 1,290 1,298
Media(6) 142 Up 2% to (19%) (40%) to (60%) 57 to 85 119
Additions to PP&E
Wireless $ 929 (2%) to (10%) Unchanged $ 840 to $ 915 $ 865
Cable Operations 829 (7%) to (16%) Unchanged 700 to 770 642