Rogers 2009 Annual Report Download - page 45
Download and view the complete annual report
Please find page 45 of the 2009 Rogers annual report below. You can navigate through the pages in the report by either clicking on the pages listed below, or by using the keyword search tool below to find specific information within the annual report.-
 1
1 -
2
-
3
-
4
-
5
-
6
-
7
-
8
-
9
-
10
-
11
-
12
-
13
-
14
-
15
-
16
-
17
-
18
-
19
-
20
-
21
-
22
-
23
-
24
-
25
-
26
-
27
-
28
-
29
-
30
-
31
-
32
-
33
-
34
-
 35
35 -
 36
36 -
 37
37 -
 38
38 -
 39
39 -
 40
40 -
 41
41 -
 42
42 -
 43
43 -
 44
44 -
 45
45 -
 46
46 -
 47
47 -
 48
48 -
 49
49 -
 50
50 -
 51
51 -
 52
52 -
 53
53 -
 54
54 -
 55
55 -
56
-
57
-
58
-
59
-
60
-
61
-
62
-
63
-
64
-
65
-
66
-
67
-
68
-
69
-
70
-
71
-
72
-
73
-
74
-
75
-
76
-
77
-
78
-
79
-
80
-
81
-
82
-
83
-
84
-
85
-
86
-
87
-
88
-
89
-
90
-
91
-
92
-
93
-
94
-
95
-
96
-
97
-
98
-
99
-
100
-
101
-
102
-
103
-
104
-
105
-
106
-
107
-
108
-
109
-
110
-
111
-
112
-
113
-
114
-
115
-
116
-
117
-
118
-
119
-
120
-
121
-
122
-
123
-
124
-
125
-
126
-
127
-
128
-
129
-
130
 |
 |

ROGERS COMMUNICATIONS INC. 2009 ANNUAL REPORT 49
MANAGEMENT’S DISCUSSION AND ANALYSIS OF FINANCIAL CONDITION AND RESULTS OF OPERATIONS
Fair Value of Derivatives
In accordance with Canadian GAAP, we have recorded our
Derivatives using an estimated credit-adjusted mark-to-market
valuation which is determined by increasing the treasury-related
discount rates used to calculate the risk-free estimated mark-to-
market valuation by an estimated bond spread (“Bond Spread”) for
the relevant term and counterparty for each derivative. In the case of
Derivatives accounted for as assets by Rogers (i.e. those Derivatives
for which the counterparties owe Rogers), the Bond Spread for
the bank counterparty was added to the risk-free discount rate to
determine the estimated credit-adjusted value whereas, in the case
of Derivatives accounted for as liabilities (i.e. those Derivatives for
which Rogers owes the counterparties), Rogers’ Bond Spread was
added to the risk-free discount rate. The estimated credit-adjusted
values of the Derivatives are subject to changes in credit spreads of
Rogers and its counterparties.
The effect of estimating the credit-adjusted fair value of
Derivatives at December 31, 2009, versus the unadjusted risk-free
mark-to-market value of Derivatives is illustrated in the table below.
As at December 31, 2009, the credit-adjusted estimated net liability
value of Rogers’ Derivatives portfolio was $1,002 million, which
is $25 million less than the unadjusted risk-free mark-to-market
net liability value.
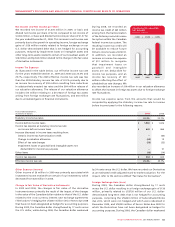
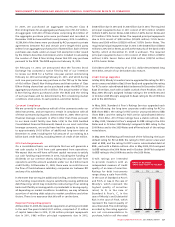
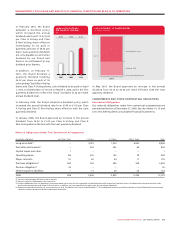
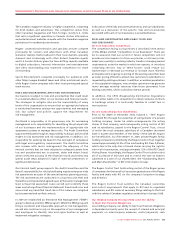
Fixed 100% Floating 0%Fixed 93% Floating 7%Fixed 83% Floating 17%
FIXED VERSUS FLOATING DEBT COMPOSITION
(% at December 31)
200920082007
(In millions of dollars)
Derivatives in an
asset position (A)
Derivatives in a
liability position (B)
Net liability
position (A + B)
Mark-to-market value - risk-free analysis $ 94 $ (1,121) $ (1,027)
Mark-to-market value - credit-adjusted estimate (carrying value) $ 82 $ (1,084) $ (1,002)
Difference $ (12) $ 37 $ 25
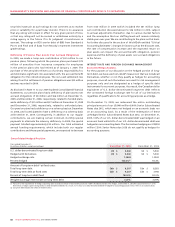
Long-Term Debt Plus Net Derivative Liabilities
The aggregate of our long-term debt plus net derivative liabilities
at the mark-to-market values using risk-free analysis (“the risk-free
analytical value”) is used by us and many analysts to most closely
represent the Company’s net debt-related obligations for valuation
purposes, and is calculated as follows:
(In millions of dollars) December 31, 2009 December 31, 2008
Long-term debt(1) $ 8,464 $ 8,507
Net derivative liabilities at the
risk-free analytical value(1) $ 1,027 $ 144
Total $ 9,491 $ 8,651
(1) Includes current and long-term portions.
We believe that the non-GAAP financial measure of long-term
debt plus net derivative liabilities (assets) at the risk-free analytical
value provides the most relevant and practical measure of our
outstanding net debt-related obligations. We use this non-GAAP
measure internally to conduct valuation-related analysis and make
capital structure related decisions and it is reviewed regularly by
management. It is also useful to investors and analysts in enabling
them to analyze the enterprise and equity value of the Company
and to assess various leverage ratios as performance measures. This
non-GAAP measure does not have a standardized meaning and
should be viewed as a supplement to, and not a substitute for, our
results of operations or financial position reported under Canadian
and U.S. GAAP.