Neiman Marcus 2005 Annual Report Download - page 91
Download and view the complete annual report
Please find page 91 of the 2005 Neiman Marcus annual report below. You can navigate through the pages in the report by either clicking on the pages listed below, or by using the keyword search tool below to find specific information within the annual report.-
 1
1 -
2
-
3
-
4
-
5
-
6
-
7
-
8
-
9
-
10
-
11
-
12
-
13
-
14
-
15
-
16
-
17
-
18
-
19
-
20
-
21
-
22
-
23
-
24
-
25
-
26
-
27
-
28
-
29
-
30
-
31
-
32
-
33
-
34
-
35
-
36
-
37
-
38
-
39
-
40
-
41
-
42
-
43
-
44
-
45
-
46
-
47
-
48
-
49
-
50
-
51
-
52
-
53
-
54
-
55
-
56
-
57
-
58
-
59
-
60
-
61
-
62
-
63
-
64
-
65
-
66
-
67
-
68
-
69
-
70
-
71
-
72
-
73
-
74
-
75
-
76
-
77
-
78
-
79
-
80
-
 81
81 -
 82
82 -
 83
83 -
 84
84 -
 85
85 -
 86
86 -
 87
87 -
 88
88 -
 89
89 -
 90
90 -
 91
91 -
 92
92 -
 93
93 -
 94
94 -
 95
95 -
 96
96 -
 97
97 -
 98
98 -
 99
99 -
 100
100 -
 101
101 -
102
-
103
-
104
-
105
-
106
-
107
-
108
-
109
-
110
-
111
-
112
-
113
-
114
-
115
-
116
-
117
-
118
-
119
-
120
-
121
-
122
-
123
-
124
-
125
-
126
-
127
-
128
-
129
-
130
-
131
-
132
-
133
-
134
-
135
-
136
-
137
-
138
-
139
-
140
-
141
-
142
-
143
-
144
-
145
-
146
-
147
-
148
-
149
-
150
-
151
-
152
-
153
-
154
-
155
-
156
-
157
-
158
-
159
-
160
-
161
-
162
-
163
-
164
-
165
-
166
-
167
-
168
-
169
-
170
-
171
-
172
-
173
-
174
-
175
-
176
-
177
-
178
-
179
-
180
-
181
-
182
-
183
-
184
-
185
-
186
-
187
-
188
-
189
-
190
-
191
-
192
-
193
-
194
 |
 |

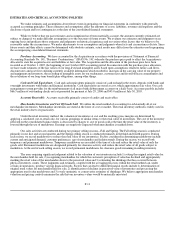
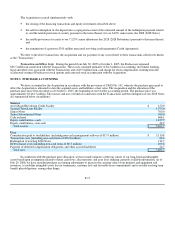
Consistent with industry business practice, we receive allowances from certain of our vendors in support of the merchandise we
purchase for resale. We receive certain allowances to reimburse us for markdowns taken and/or to support the gross margins earned in
connection with the sales of the vendor's merchandise. We recognize these allowances as an increase to gross margin when the
allowances are earned and approved by the vendor. Other allowances we receive represent reductions to the amounts paid to acquire the
merchandise. We recognize these allowances as a reduction in the cost of the acquired merchandise resulting in an increase to gross
margin at the time the goods are sold. The amounts of vendor reimbursements we received did not have a significant impact on the year-
over-year change in gross margin during fiscal years 2006, 2005 or 2004. Vendor allowances received were $86.8 million for the forty-
three weeks ended July 29, 2006, $2.1 million for the nine weeks ended October 1, 2005, $82.8 million in fiscal year 2005 and
$79.3 million in fiscal year 2004.
We obtain certain merchandise, primarily precious jewelry, on a consignment basis in order to expand our product assortment.
Consignment merchandise with a cost basis of $251.3 million at July 29, 2006 and $226.8 million at July 30, 2005 is not reflected in our
consolidated balance sheets.
Long-lived Assets. Property and equipment are stated at historical cost less accumulated depreciation. For financial reporting
purposes, we compute depreciation principally using the straight-line method over the estimated useful lives of the assets. Buildings and
improvements are depreciated over five to 30 years while fixtures and equipment are depreciated over three to 15 years. Leasehold
improvements are amortized over the shorter of the asset life or the lease term. Costs incurred for the development of internal computer
software are capitalized and amortized using the straight-line method over three to ten years.
To the extent we remodel or otherwise replace or dispose of property and equipment prior to the end of the assigned depreciable
lives, we could realize a loss or gain on the disposition. To the extent assets continue to be used beyond their assigned depreciable lives,
no depreciation expense is incurred. We reassess the depreciable lives of our long-lived assets in an effort to reduce the risk of significant
losses or gains at disposition and utilization of assets with no depreciation charges. The reassessment of depreciable lives involves
utilizing historical remodel and disposition activity and forward-looking capital expenditure plans.
We assess the recoverability of the carrying values of our store assets annually and upon the occurrence of certain events (e.g.,
opening a new store near an existing store or announcing plans for a store closing). The recoverability assessment requires judgment and
estimates of future store generated cash flows. The underlying estimates of cash flows include estimates for future revenues, gross margin
rates and store expenses. We base these estimates upon the stores' past and expected future performance. New stores may require two to
five years to develop a customer base necessary to generate the cash flows of our more mature stores. To the extent our estimates for
revenue growth and gross margin improvement are not realized, future annual assessments could result in impairment charges.
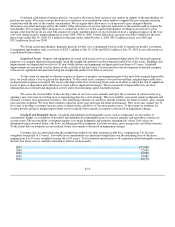
Goodwill and Intangible Assets. Goodwill and indefinite-lived intangible assets, such as tradenames, are not subject to
amortization. Rather, recoverability of goodwill and indefinite-lived intangible assets is assessed annually and upon the occurrence of
certain events. The recoverability assessment requires us to make judgments and estimates regarding fair values. Fair values are
determined using estimated future cash flows, including growth assumptions for future revenues, gross margin rates and other estimates.
To the extent that our estimates are not realized, future assessments could result in impairment charges.
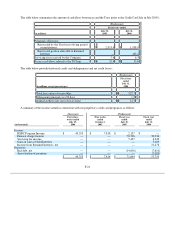
Customer lists are amortized using the straight-line method over their estimated useful lives, ranging from 5 to 26 years
(weighted average life of 13 years). Favorable lease commitments are amortized straight-line over the remaining lives of the leases,
ranging from 6 to 49 years (weighted average life of 33 years). Total estimated amortization of all acquisition-related intangible assets for
the next five fiscal years is currently estimated as follows (in thousands):
2007 $ 72,889
2008 72,889
2009 72,889
2010 72,889
2011 62,178
F-12