Neiman Marcus 2005 Annual Report Download - page 140
Download and view the complete annual report
Please find page 140 of the 2005 Neiman Marcus annual report below. You can navigate through the pages in the report by either clicking on the pages listed below, or by using the keyword search tool below to find specific information within the annual report.-
 1
1 -
2
-
3
-
4
-
5
-
6
-
7
-
8
-
9
-
10
-
11
-
12
-
13
-
14
-
15
-
16
-
17
-
18
-
19
-
20
-
21
-
22
-
23
-
24
-
25
-
26
-
27
-
28
-
29
-
30
-
31
-
32
-
33
-
34
-
35
-
36
-
37
-
38
-
39
-
40
-
41
-
42
-
43
-
44
-
45
-
46
-
47
-
48
-
49
-
50
-
51
-
52
-
53
-
54
-
55
-
56
-
57
-
58
-
59
-
60
-
61
-
62
-
63
-
64
-
65
-
66
-
67
-
68
-
69
-
70
-
71
-
72
-
73
-
74
-
75
-
76
-
77
-
78
-
79
-
80
-
81
-
82
-
83
-
84
-
85
-
86
-
87
-
88
-
89
-
90
-
91
-
92
-
93
-
94
-
95
-
96
-
97
-
98
-
99
-
100
-
101
-
102
-
103
-
104
-
105
-
106
-
107
-
108
-
109
-
110
-
111
-
112
-
113
-
114
-
115
-
116
-
117
-
118
-
119
-
120
-
121
-
122
-
123
-
124
-
125
-
126
-
127
-
128
-
129
-
 130
130 -
 131
131 -
 132
132 -
 133
133 -
 134
134 -
 135
135 -
 136
136 -
 137
137 -
 138
138 -
 139
139 -
 140
140 -
 141
141 -
 142
142 -
 143
143 -
 144
144 -
 145
145 -
 146
146 -
 147
147 -
 148
148 -
 149
149 -
 150
150 -
151
-
152
-
153
-
154
-
155
-
156
-
157
-
158
-
159
-
160
-
161
-
162
-
163
-
164
-
165
-
166
-
167
-
168
-
169
-
170
-
171
-
172
-
173
-
174
-
175
-
176
-
177
-
178
-
179
-
180
-
181
-
182
-
183
-
184
-
185
-
186
-
187
-
188
-
189
-
190
-
191
-
192
-
193
-
194
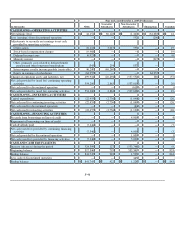
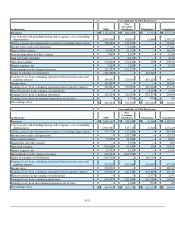
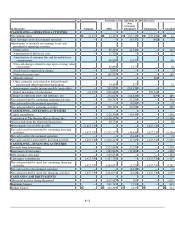
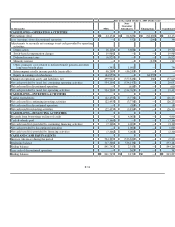
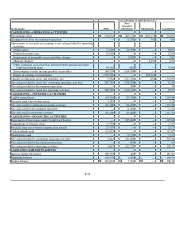
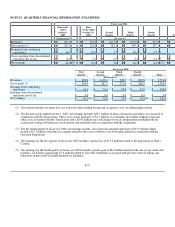
 |
 |
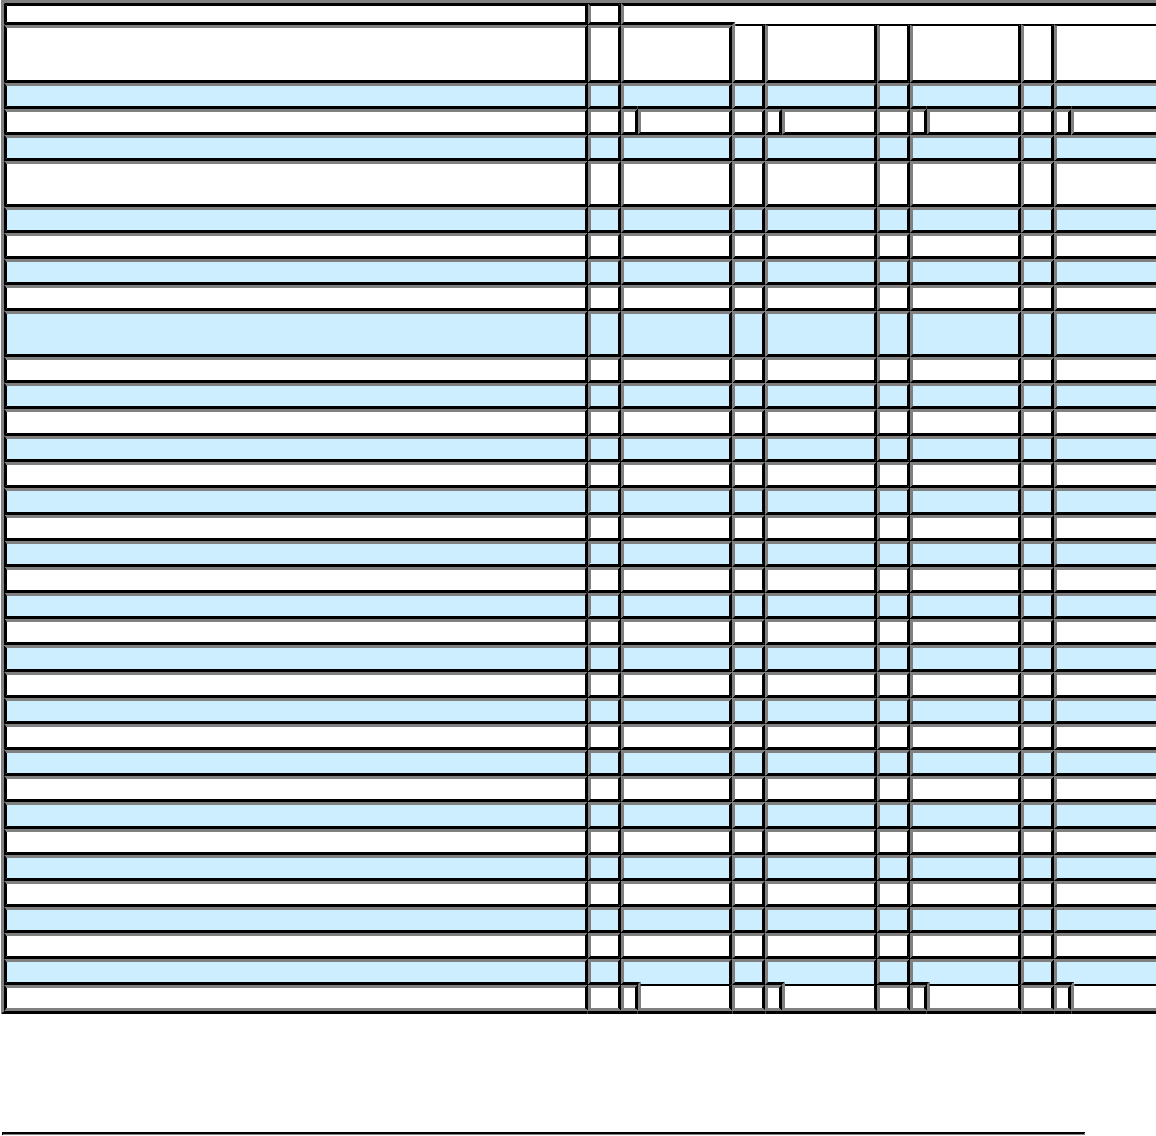
Year ended July 31, 2004 (Predecessor)
(in thousands) NMG
Non-
Guarantor
Subsidiaries Eliminations Consolidated
CASH FLOWS—OPERATING ACTIVITIES
Net earnings (loss) $ 204,832 $ 263,178 $ (263,178 ) $ 204,832
(Earnings) loss from discontinued operation — (1,242 ) 592 (650
Adjustments to reconcile net earnings to net cash provided by operating
activities:
Depreciation 77,659 20,392 — 98,051
Deferred income taxes 22,969 — — 22,969
Impairment of intangible assets and other charges — 3,853 — 3,853
Minority Interest — — 2,957 2,957
Other, primarily costs related to defined benefit pension and other
long-term benefit plans 34,562 (682 ) — 33,880
Intercompany royalty income payable (receivable) 164,994 (164,994 ) — —
Equity in earnings of subsidiaries (259,791 ) — 259,791 —
Changes in operating assets and liabilities, net 3,564 (317,431 )(162 )(314,029
Net cash provided by (used for) continuing operating activities 248,789 (196,926 ) — 51,863
Net cash provided by discontinued operation — 709 — 709
Net cash provided by (used for) operating activities 248,789 (196,217 )— 52,572
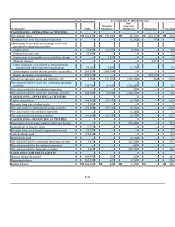
CASH FLOWS—INVESTING ACTIVITIES
Capital expenditures (94,591 ) (24,478 ) — (119,069
Proceeds from sale of other assets 3,183 — — 3,183
Net cash used for continuing investing activities (91,408 ) (24,478 ) — (115,886
Net cash used for discontinued operation — (1,404 )— (1,404
Net cash used for investing activities (91,408 )(25,882 )— (117,290
CASH FLOWS—FINANCING ACTIVITIES
Repayment of borrowings under Credit Card Facility — 225,000 — 225,000
Acquisitions of treasury stock (7,553 ) — — (7,553
Proceeds from stock-based compensation awards 23,797 — — 23,797
Cash dividends paid (12,632 ) — — (12,632
Distributions paid — (3,172 )— (3,172
Net cash provided by continuing financing activities 3,612 221,828 — 225,440
Net cash provided by discontinued operation — 695 — 695
Net cash provided by financing activities 3,612 222,523 — 226,135
CASH AND CASH EQUIVALENTS
Increase during the period 160,993 424 — 161,417
Beginning balance 202,070 4,880 — 206,950
Ending balance $ 363,063 $ 5,304 $ — $ 368,367
F-56