Neiman Marcus 2005 Annual Report Download - page 128
Download and view the complete annual report
Please find page 128 of the 2005 Neiman Marcus annual report below. You can navigate through the pages in the report by either clicking on the pages listed below, or by using the keyword search tool below to find specific information within the annual report.-
 1
1 -
2
-
3
-
4
-
5
-
6
-
7
-
8
-
9
-
10
-
11
-
12
-
13
-
14
-
15
-
16
-
17
-
18
-
19
-
20
-
21
-
22
-
23
-
24
-
25
-
26
-
27
-
28
-
29
-
30
-
31
-
32
-
33
-
34
-
35
-
36
-
37
-
38
-
39
-
40
-
41
-
42
-
43
-
44
-
45
-
46
-
47
-
48
-
49
-
50
-
51
-
52
-
53
-
54
-
55
-
56
-
57
-
58
-
59
-
60
-
61
-
62
-
63
-
64
-
65
-
66
-
67
-
68
-
69
-
70
-
71
-
72
-
73
-
74
-
75
-
76
-
77
-
78
-
79
-
80
-
81
-
82
-
83
-
84
-
85
-
86
-
87
-
88
-
89
-
90
-
91
-
92
-
93
-
94
-
95
-
96
-
97
-
98
-
99
-
100
-
101
-
102
-
103
-
104
-
105
-
106
-
107
-
108
-
109
-
110
-
111
-
112
-
113
-
114
-
115
-
116
-
117
-
 118
118 -
 119
119 -
 120
120 -
 121
121 -
 122
122 -
 123
123 -
 124
124 -
 125
125 -
 126
126 -
 127
127 -
 128
128 -
 129
129 -
 130
130 -
 131
131 -
 132
132 -
 133
133 -
 134
134 -
 135
135 -
 136
136 -
 137
137 -
 138
138 -
139
-
140
-
141
-
142
-
143
-
144
-
145
-
146
-
147
-
148
-
149
-
150
-
151
-
152
-
153
-
154
-
155
-
156
-
157
-
158
-
159
-
160
-
161
-
162
-
163
-
164
-
165
-
166
-
167
-
168
-
169
-
170
-
171
-
172
-
173
-
174
-
175
-
176
-
177
-
178
-
179
-
180
-
181
-
182
-
183
-
184
-
185
-
186
-
187
-
188
-
189
-
190
-
191
-
192
-
193
-
194
 |
 |
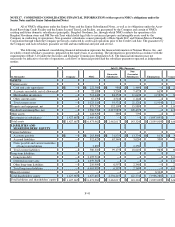
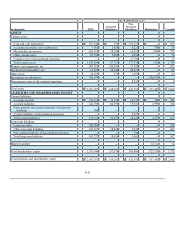
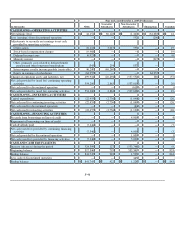
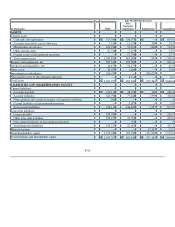
Forty-three weeks ended July 29, 2006 (Successor)
(in thousands) Company NMG
Guarantor
Subsidiaries
Non-
Guarantor
Subsidiaries Eliminations Consolidated
CASH FLOWS—OPERATING
ACTIVITIES
Net earnings (loss) $ 12,455 $ 12,455 $ 260,981 $ (15,232 ) $ (258,204 ) $ 12,455
Loss (earnings) from discontinued
operation — — — 14,317 (462 ) 13,855
Adjustments to reconcile net earnings to
net cash provided by operating
activities:
Depreciation — 89,545 17,028 4,513 — 111,086
Amortization of debt issue costs — 11,728 — — — 11,728
Amortization of customer lists and
favorable lease commitments — 49,830 9,760 575 — 60,165
Non-cash charges related to step-up in
carrying value of inventory — 32,890 5,177 — — 38,067
Stock-based compensation charges — 3,951 — — — 3,951
Deferred income taxes — (65,939 ) — — — (65,939
Minority interest — — — — 204
Other, primarily costs related to defined
benefit pension and other long-term
benefit plans — 14,438 1,590 (713 ) — 15,315
Intercompany royalty income payable
(receivable) — 201,878 (201,878 ) — —
Equity in earnings of subsidiaries (12,455 ) (246,686 ) — — 259,141
Changes in operating assets and liabilities,
net — 254,617 (81,204 )16,385 (679 )189,119
Net cash provided by continuing operating
activities — 358,707 11,454 19,845 — 390,006
Net cash used for discontinued operation — — — (9,241 )— (9,241
Net cash provided by operating activities — 358,707 11,454 10,604 — 380,765
CASH FLOWS—INVESTING
ACTIVITIES
Capital expenditures — (126,546 ) (11,390 ) (3,054 ) — (140,990
Acquisition of The Neiman Marcus
Group, Inc. — (5,156,423 ) — — — (5,156,423
Net proceeds from the Gurwitch
Disposition — 40,752 — — — 40,752
Intercompany (receivable) payable (1,427,739 )— — — 1,427,739
Net cash used for continuing investing
activities (1,427,739 ) (5,242,217 ) (11,390 ) (3,054 ) 1,427,739 (5,256,661
Net cash used for discontinued operation — — — (3,141 )— (3,141
Net cash used for investing activities (1,427,739 )(5,242,217 )(11,390 )(6,195 )1,427,739 (5,259,802
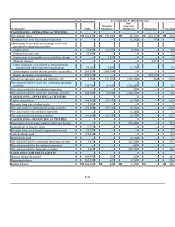
CASH FLOWS—FINANCING
ACTIVITIES
Proceeds from borrowings — 3,325,000 — 15,250 — 3,340,250
Repayment of borrowings — (385,812 ) — (17,000 ) — (402,812
Debt issuance costs paid — (102,854 ) — — — (102,854
Cash equity contributions 1,427,739 1,427,739 — — (1,427,739 )1,427,739
Net cash provided by (used for) continuing
financing activities 1,427,739 4,264,073 — (1,750 ) (1,427,739 ) 4,262,323
Net cash used for discontinued operation — — — (2,418 )— (2,418
Net cash provided by (used for) financing
activities 1,427,739 4,264,073 — (4,168 )(1,427,739 )4,259,905
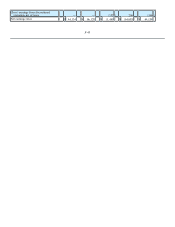
CASH AND CASH EQUIVALENTS