Neiman Marcus 2005 Annual Report Download - page 123
Download and view the complete annual report
Please find page 123 of the 2005 Neiman Marcus annual report below. You can navigate through the pages in the report by either clicking on the pages listed below, or by using the keyword search tool below to find specific information within the annual report.-
 1
1 -
2
-
3
-
4
-
5
-
6
-
7
-
8
-
9
-
10
-
11
-
12
-
13
-
14
-
15
-
16
-
17
-
18
-
19
-
20
-
21
-
22
-
23
-
24
-
25
-
26
-
27
-
28
-
29
-
30
-
31
-
32
-
33
-
34
-
35
-
36
-
37
-
38
-
39
-
40
-
41
-
42
-
43
-
44
-
45
-
46
-
47
-
48
-
49
-
50
-
51
-
52
-
53
-
54
-
55
-
56
-
57
-
58
-
59
-
60
-
61
-
62
-
63
-
64
-
65
-
66
-
67
-
68
-
69
-
70
-
71
-
72
-
73
-
74
-
75
-
76
-
77
-
78
-
79
-
80
-
81
-
82
-
83
-
84
-
85
-
86
-
87
-
88
-
89
-
90
-
91
-
92
-
93
-
94
-
95
-
96
-
97
-
98
-
99
-
100
-
101
-
102
-
103
-
104
-
105
-
106
-
107
-
108
-
109
-
110
-
111
-
112
-
 113
113 -
 114
114 -
 115
115 -
 116
116 -
 117
117 -
 118
118 -
 119
119 -
 120
120 -
 121
121 -
 122
122 -
 123
123 -
 124
124 -
 125
125 -
 126
126 -
 127
127 -
 128
128 -
 129
129 -
 130
130 -
 131
131 -
 132
132 -
 133
133 -
134
-
135
-
136
-
137
-
138
-
139
-
140
-
141
-
142
-
143
-
144
-
145
-
146
-
147
-
148
-
149
-
150
-
151
-
152
-
153
-
154
-
155
-
156
-
157
-
158
-
159
-
160
-
161
-
162
-
163
-
164
-
165
-
166
-
167
-
168
-
169
-
170
-
171
-
172
-
173
-
174
-
175
-
176
-
177
-
178
-
179
-
180
-
181
-
182
-
183
-
184
-
185
-
186
-
187
-
188
-
189
-
190
-
191
-
192
-
193
-
194
 |
 |

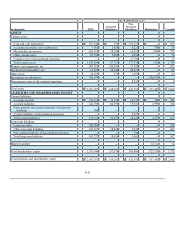
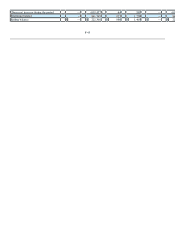
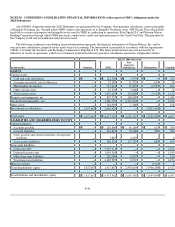
July 30, 2005 (Predecessor)
(in thousands) NMG
Guarantor
Subsidiaries
Non-
Guarantor
Subsidiaries Eliminations Consolidated
ASSETS
Current assets:
Cash and cash equivalents $ 317,346 $ 795 $ 535,278 $ — $ 853,419
Accounts receivable, net of allowance 7,910 2,929 8,221 338 19,398
Merchandise inventories 650,918 78,390 14,423 (840 ) 742,891
Other current assets 67,720 5,603 1,654 — 74,977
Current assets of discontinued operation — — 17,796 — 17,796
Total current assets 1,043,894 87,717 577,372 (502 )1,708,481
Property and equipment, net 697,514 136,503 17,399 — 851,416
Goodwill and intangibles, net 14,875 23,700 28,477 — 67,052
Other assets 24,035 371 1,195 — 25,601
Investments in subsidiaries 706,979 — — (706,979 )
Non-current assets of discontinued operation — — 8,110 — 8,110
Total assets $ 2,487,297 $ 248,291 $ 632,553 $ (707,481 )$ 2,660,660
LIABILITIES AND SHAREHOLDERS' EQUITY
Current liabilities:
Accounts payable $ 233,116 $ 32,199 $ 14,779 $ 338 $ 280,432
Accrued liabilities 244,798 60,396 19,452 1,999 326,645
Notes payable and current maturities of long-term
liabilities 200 — — — 200
Current liabilities of discontinued operation — — 9,997 — 9,997
Total current liabilities 478,114 92,595 44,228 2,337 617,274
Long-term liabilities:
Long-term debt 249,780 — — — 249,780
Other long-term liabilities 185,457 18,626 2,933 — 207,016
Non-current liabilities of discontinued operation — — 532 — 532
Total long-term liabilities 435,237 18,626 3,465 — 457,328
Minority interest — — — 12,112 12,112
Total shareholders' equity 1,573,946 137,070 584,860 (721,930 )1,573,946
Total liabilities and shareholders' equity $ 2,487,297 $ 248,291 $ 632,553 $ (707,481 )$ 2,660,660
F-42