Neiman Marcus 2005 Annual Report Download - page 32
Download and view the complete annual report
Please find page 32 of the 2005 Neiman Marcus annual report below. You can navigate through the pages in the report by either clicking on the pages listed below, or by using the keyword search tool below to find specific information within the annual report.-
 1
1 -
2
-
3
-
4
-
5
-
6
-
7
-
8
-
9
-
10
-
11
-
12
-
13
-
14
-
15
-
16
-
17
-
18
-
19
-
20
-
21
-
 22
22 -
 23
23 -
 24
24 -
 25
25 -
 26
26 -
 27
27 -
 28
28 -
 29
29 -
 30
30 -
 31
31 -
 32
32 -
 33
33 -
 34
34 -
 35
35 -
 36
36 -
 37
37 -
 38
38 -
 39
39 -
 40
40 -
 41
41 -
 42
42 -
43
-
44
-
45
-
46
-
47
-
48
-
49
-
50
-
51
-
52
-
53
-
54
-
55
-
56
-
57
-
58
-
59
-
60
-
61
-
62
-
63
-
64
-
65
-
66
-
67
-
68
-
69
-
70
-
71
-
72
-
73
-
74
-
75
-
76
-
77
-
78
-
79
-
80
-
81
-
82
-
83
-
84
-
85
-
86
-
87
-
88
-
89
-
90
-
91
-
92
-
93
-
94
-
95
-
96
-
97
-
98
-
99
-
100
-
101
-
102
-
103
-
104
-
105
-
106
-
107
-
108
-
109
-
110
-
111
-
112
-
113
-
114
-
115
-
116
-
117
-
118
-
119
-
120
-
121
-
122
-
123
-
124
-
125
-
126
-
127
-
128
-
129
-
130
-
131
-
132
-
133
-
134
-
135
-
136
-
137
-
138
-
139
-
140
-
141
-
142
-
143
-
144
-
145
-
146
-
147
-
148
-
149
-
150
-
151
-
152
-
153
-
154
-
155
-
156
-
157
-
158
-
159
-
160
-
161
-
162
-
163
-
164
-
165
-
166
-
167
-
168
-
169
-
170
-
171
-
172
-
173
-
174
-
175
-
176
-
177
-
178
-
179
-
180
-
181
-
182
-
183
-
184
-
185
-
186
-
187
-
188
-
189
-
190
-
191
-
192
-
193
-
194
 |
 |

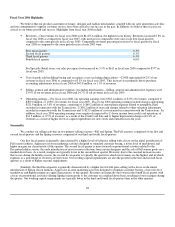
Fiscal Year 2006 Highlights
We believe that our product assortment of luxury, designer and fashion merchandise, coupled with our sales promotion activities
and our commitment to superior customer service, have been critical to our success in the past. In addition, we believe these factors are
critical to our future growth and success. Highlights from fiscal year 2006 include:
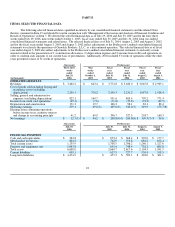
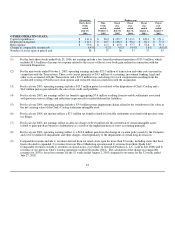
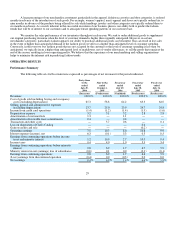
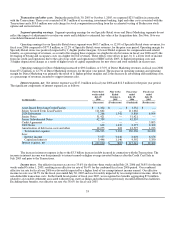
• Revenues—Our revenues for fiscal year 2006 were $4,105.6 million, the highest in our history. Revenues increased 8.8% in
fiscal year 2006 as compared to fiscal year 2005, with increases in comparable store sales in all four fiscal quarters
compared to the same periods in fiscal year 2005. Comparable revenues percentage increases by fiscal quarter for fiscal
year 2006 as compared to the same periods in fiscal year 2005 were:
First fiscal quarter 8.3%
Second fiscal quarter 6.3%
Third fiscal quarter 6.3%
Fourth fiscal quarter 6.6%
For Specialty Retail stores, our sales per square foot increased by 5.9% to $611 in fiscal year 2006 compared to $577 in
fiscal year 2005.
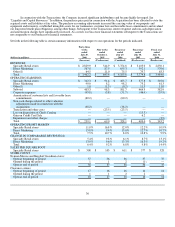
• Cost of goods sold including buying and occupancy costs (excluding depreciation)—COGS represented 64.2% of our
revenues in fiscal year 2006 as compared to 63.3% for fiscal year 2005. This increase was primarily due to purchase
accounting adjustments in fiscal year 2006 of $43.8 million, or 1.1% of revenues.
• Selling, general and administrative expenses (excluding depreciation)—Selling, general and administrative expenses were
23.9% of our revenues in fiscal year 2006 and 24.7% of our revenues in fiscal year 2005.
• Operating earnings— For fiscal year 2006, our operating earnings were $328.1 million, or 8.0% of revenues, compared to
$409.0 million, or 10.8% of revenues for fiscal year 2005. Fiscal year 2006 operating earnings include charges aggregating
$121.9 million, or 3.0% of revenues, consisting of 1) $60.2 million of amortization expense related to intangible assets
recorded in connection with the Transactions, 2) $38.2 million of non-cash charges related to other valuation adjustments
recorded in connection with the Transactions and 3) $23.5 million of costs incurred in connection with the Transactions. In
addition, fiscal year 2006 operating earnings were negatively impacted by 1) lower income from credit card operations of
$14.5 million, or 0.5% of revenues, as a result of the Credit Card Sale and 2) higher depreciation charges of 0.4% of
revenues as a result of higher levels of capital expenditures for new stores and remodels in recent years.
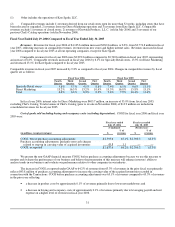
Seasonality
We conduct our selling activities in two primary selling seasons—Fall and Spring. The Fall season is comprised of our first and
second fiscal quarters and the Spring season is comprised of our third and fourth fiscal quarters.
Our first fiscal quarter is generally characterized by a higher level of full-price selling with a focus on the initial introduction of
Fall season fashions. Aggressive in-store marketing activities designed to stimulate customer buying, a lower level of markdowns and
higher margins are characteristic of this quarter. The second fiscal quarter is more focused on promotional activities related to the
December holiday season, the early introduction of resort season collections from certain designers and the sale of Fall season goods on a
marked down basis. As a result, margins are typically lower in the second fiscal quarter. However, due to the seasonal increase in sales
that occurs during the holiday season, the second fiscal quarter is typically the quarter in which our revenues are the highest and in which
expenses as a percentage of revenues are the lowest. Our working capital requirements are also the greatest in the first and second fiscal
quarters as a result of higher seasonal requirements.
Similarly, the third fiscal quarter is generally characterized by a higher level of full-price selling with a focus on the initial
introduction of Spring season fashions. Aggressive in-store marketing activities designed to stimulate customer buying, a lower level of
markdowns and higher margins are again characteristic of this quarter. Revenues are generally the lowest in the fourth fiscal quarter with
a focus on promotional activities offering Spring season goods to the customer on a marked down basis, resulting in lower margins during
the quarter. Our working capital requirements are typically lower in the third and fourth fiscal quarters than in the other quarters.
28