Neiman Marcus 2005 Annual Report Download - page 34
Download and view the complete annual report
Please find page 34 of the 2005 Neiman Marcus annual report below. You can navigate through the pages in the report by either clicking on the pages listed below, or by using the keyword search tool below to find specific information within the annual report.-
 1
1 -
2
-
3
-
4
-
5
-
6
-
7
-
8
-
9
-
10
-
11
-
12
-
13
-
14
-
15
-
16
-
17
-
18
-
19
-
20
-
21
-
22
-
23
-
 24
24 -
 25
25 -
 26
26 -
 27
27 -
 28
28 -
 29
29 -
 30
30 -
 31
31 -
 32
32 -
 33
33 -
 34
34 -
 35
35 -
 36
36 -
 37
37 -
 38
38 -
 39
39 -
 40
40 -
 41
41 -
 42
42 -
 43
43 -
 44
44 -
45
-
46
-
47
-
48
-
49
-
50
-
51
-
52
-
53
-
54
-
55
-
56
-
57
-
58
-
59
-
60
-
61
-
62
-
63
-
64
-
65
-
66
-
67
-
68
-
69
-
70
-
71
-
72
-
73
-
74
-
75
-
76
-
77
-
78
-
79
-
80
-
81
-
82
-
83
-
84
-
85
-
86
-
87
-
88
-
89
-
90
-
91
-
92
-
93
-
94
-
95
-
96
-
97
-
98
-
99
-
100
-
101
-
102
-
103
-
104
-
105
-
106
-
107
-
108
-
109
-
110
-
111
-
112
-
113
-
114
-
115
-
116
-
117
-
118
-
119
-
120
-
121
-
122
-
123
-
124
-
125
-
126
-
127
-
128
-
129
-
130
-
131
-
132
-
133
-
134
-
135
-
136
-
137
-
138
-
139
-
140
-
141
-
142
-
143
-
144
-
145
-
146
-
147
-
148
-
149
-
150
-
151
-
152
-
153
-
154
-
155
-
156
-
157
-
158
-
159
-
160
-
161
-
162
-
163
-
164
-
165
-
166
-
167
-
168
-
169
-
170
-
171
-
172
-
173
-
174
-
175
-
176
-
177
-
178
-
179
-
180
-
181
-
182
-
183
-
184
-
185
-
186
-
187
-
188
-
189
-
190
-
191
-
192
-
193
-
194
 |
 |

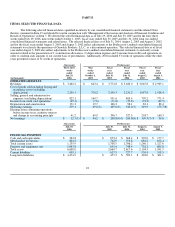
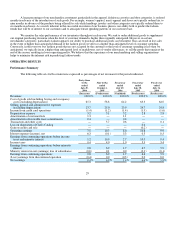
In connection with the Transactions, the Company incurred significant indebtedness and became highly leveraged. See
"Liquidity and Capital Resources." In addition, the purchase price paid in connection with the Acquisition has been allocated to state the
acquired assets and liabilities at fair value. The purchase accounting adjustments increased the carrying value of our property and
equipment and inventory, established intangible assets for our tradenames, customer lists and favorable lease commitments and revalued
our long-term benefit plan obligations, among other things. Subsequent to the Transactions, interest expense and non-cash depreciation
and amortization charges have significantly increased. As a result, our Successor financial statements subsequent to the Transactions are
not comparable to our Predecessor financial statements.
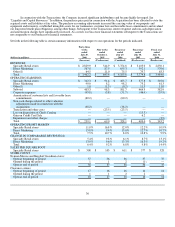
Set forth in the following table is certain summary information with respect to our operations for the periods indicated.
(dollars in millions)
Forty-three
weeks
ended
July 29,
2006
Nine weeks
ended
October 1,
2005
Fiscal year
ended
July 29,
2006
Fiscal year
ended
July 30,
2005
Fiscal year
ended
July 31,
2004
(Successor) (Predecessor) (Combined) (Predecessor) (Predecessor)
REVENUES
Specialty Retail stores $ 2,829.9 $ 544.9 $ 3,374.8 $ 3,103.0 $ 2,850.1
Direct Marketing 567.8 87.5 655.3 592.1 570.6
Other(1) 64.5 11.0 75.5 79.7 63.3
Total $ 3,462.2 $ 643.4 $ 4,105.6 $ 3,774.8 $ 3,484.0
OPERATING EARNINGS
Specialty Retail stores $ 312.3 $ 91.4 $ 403.7 $ 377.8 $ 310.6
Direct Marketing 90.0 8.2 98.2 75.2 61.3
Other(1) 1.0 (1.3)(0.2)11.5 11.0
Subtotal 403.3 98.3 501.7 464.5 382.9
Corporate expenses (45.8) (5.8) (51.7) (46.4) (35.8)
Amortization of customer lists and favorable lease
commitments (60.2) — (60.2) — —
Non-cash charges related to other valuation
adjustments made in connection with the
Acquisition (38.2) — (38.2) — —
Transaction and other costs — (23.5) (23.5) — —
Loss on disposition of Chef's Catalog — — — (15.3) —
Gain on Credit Card Sale — — — 6.2 —
Impairment and other charges — — — — (3.9)
Total $ 259.1 $ 69.0 $ 328.1 $ 409.0 $ 343.2
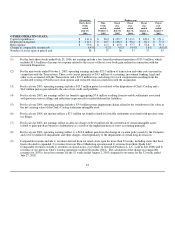
OPERATING PROFIT MARGIN
Specialty Retail stores 11.0% 16.8% 12.0% 12.2% 10.9%
Direct Marketing 15.8% 9.4% 15.0% 12.7% 10.7%
Total 7.5% 10.7% 8.0% 10.8% 9.9%
CHANGE IN COMPARABLE REVENUES(2)
Specialty Retail stores 5.4% 9.8% 6.1% 8.7% 13.1%
Direct Marketing 13.9% 9.6% 13.3% 16.3% 19.2%
Total 6.4% 9.2% 6.8% 9.8% 14.4%
SALES PER SQUARE FOOT
Specialty Retail stores $ 508 $ 103 $ 611 $ 577 $ 528
STORE COUNT
Neiman Marcus and Bergdorf Goodman stores:
Open at beginning of period 37 36 36 37 37
Opened during the period 1 1 2 (1)—
Open at end of period 38 37 38 36 37
Clearance centers:
Open at beginning of period 17 16 16 14 14
Opened during the period 1 1 2 2 —
Open at end of period 18 17 18 16 14
30