Neiman Marcus 2005 Annual Report Download - page 30
Download and view the complete annual report
Please find page 30 of the 2005 Neiman Marcus annual report below. You can navigate through the pages in the report by either clicking on the pages listed below, or by using the keyword search tool below to find specific information within the annual report.-
 1
1 -
2
-
3
-
4
-
5
-
6
-
7
-
8
-
9
-
10
-
11
-
12
-
13
-
14
-
15
-
16
-
17
-
18
-
19
-
 20
20 -
 21
21 -
 22
22 -
 23
23 -
 24
24 -
 25
25 -
 26
26 -
 27
27 -
 28
28 -
 29
29 -
 30
30 -
 31
31 -
 32
32 -
 33
33 -
 34
34 -
 35
35 -
 36
36 -
 37
37 -
 38
38 -
 39
39 -
 40
40 -
41
-
42
-
43
-
44
-
45
-
46
-
47
-
48
-
49
-
50
-
51
-
52
-
53
-
54
-
55
-
56
-
57
-
58
-
59
-
60
-
61
-
62
-
63
-
64
-
65
-
66
-
67
-
68
-
69
-
70
-
71
-
72
-
73
-
74
-
75
-
76
-
77
-
78
-
79
-
80
-
81
-
82
-
83
-
84
-
85
-
86
-
87
-
88
-
89
-
90
-
91
-
92
-
93
-
94
-
95
-
96
-
97
-
98
-
99
-
100
-
101
-
102
-
103
-
104
-
105
-
106
-
107
-
108
-
109
-
110
-
111
-
112
-
113
-
114
-
115
-
116
-
117
-
118
-
119
-
120
-
121
-
122
-
123
-
124
-
125
-
126
-
127
-
128
-
129
-
130
-
131
-
132
-
133
-
134
-
135
-
136
-
137
-
138
-
139
-
140
-
141
-
142
-
143
-
144
-
145
-
146
-
147
-
148
-
149
-
150
-
151
-
152
-
153
-
154
-
155
-
156
-
157
-
158
-
159
-
160
-
161
-
162
-
163
-
164
-
165
-
166
-
167
-
168
-
169
-
170
-
171
-
172
-
173
-
174
-
175
-
176
-
177
-
178
-
179
-
180
-
181
-
182
-
183
-
184
-
185
-
186
-
187
-
188
-
189
-
190
-
191
-
192
-
193
-
194
 |
 |

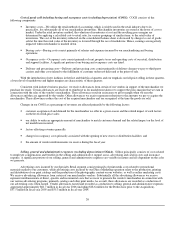
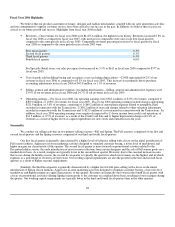
Cost of goods sold including buying and occupancy costs (excluding depreciation) (COGS). COGS consists of the
following components:
• Inventory costs—We utilize the retail method of accounting, which is widely used in the retail industry due to its
practicality, for substantially all of our merchandise inventories. Merchandise inventories are stated at the lower of cost or
market. Under the retail inventory method, the valuation of inventories at cost and the resulting gross margins are
determined by applying a calculated cost-to-retail ratio, for various groupings of similar items, to the retail value of
inventories. The cost of the inventory reflected on the consolidated balance sheet is decreased by charges to cost of goods
sold at the time the retail value of the inventory is lowered through the use of markdowns. Hence, earnings are negatively
impacted when merchandise is marked down.
• Buying costs—Buying costs consist primarily of salaries and expenses incurred by our merchandising and buying
operations.
• Occupancy costs—Occupancy costs consist primarily of rent, property taxes and operating costs of our retail, distribution
and support facilities. A significant portion of our buying and occupancy costs are fixed.
• Delivery and processing costs—Delivery and processing costs consist primarily of delivery charges we pay to third-party
carriers and other costs related to the fulfillment of customer orders not delivered at the point-of-sale.
With the introduction of new fashions in the first and third fiscal quarters and our emphasis on full-price selling in these quarters,
a lower level of markdowns and higher margins are characteristic of these quarters.
Consistent with industry business practice, we receive allowances from certain of our vendors in support of the merchandise we
purchase for resale. Certain allowances are received to reimburse us for markdowns taken or to support the gross margins that we earn in
connection with the sales of the vendor's merchandise. These allowances result in an increase to gross margin when we earn the
allowances and they are approved by the vendor. Other allowances we receive represent reductions to the amounts we pay to acquire the
merchandise. These allowances reduce the cost of the acquired merchandise and are recognized at the time the goods are sold.
Changes in our COGS as a percentage of revenues are affected primarily by the following factors:
• customer acceptance of and demand for the merchandise we offer in a given season and the related impact of such factors
on the level of full-price sales;
• our ability to order an appropriate amount of merchandise to match customer demand and the related impact on the level of
net markdowns incurred;
• factors affecting revenues generally;
• changes in occupancy costs primarily associated with the opening of new stores or distribution facilities; and
• the amount of vendor reimbursements we receive during the fiscal year.
Selling, general and administrative expenses (excluding depreciation) (SG&A). SG&A principally consists of costs related
to employee compensation and benefits in the selling and administrative support areas, advertising and catalog costs and insurance
expense. A significant portion of our selling, general and administrative expenses are variable in nature and are dependent on the sales
we generate.
Advertising costs incurred by our Specialty Retail segment consist primarily of print media costs related to promotional
materials mailed to our customers, while advertising costs incurred by our Direct Marketing operation relate to the production, printing
and distribution of our print catalogs and the production of the photographic content on our websites, as well as online marketing costs.
We receive advertising allowances from certain of our merchandise vendors. Substantially all the advertising allowances we receive
represent reimbursements of direct, specific and incremental costs that we incur to promote the vendor's merchandise in connection with
our various advertising programs, primarily catalogs and other print media. As a result, these allowances are recorded as a reduction of
our advertising costs when earned. Vendor allowances earned and recorded as a reduction to selling, general and administrative expenses
aggregated approximately $61.7 million in fiscal year 2006 (including $18.6 million for the Predecessor prior to the Acquisition),
$57.5 million in fiscal year 2005 and $55.3 million in fiscal year 2004.
26