Neiman Marcus 2005 Annual Report Download - page 38
Download and view the complete annual report
Please find page 38 of the 2005 Neiman Marcus annual report below. You can navigate through the pages in the report by either clicking on the pages listed below, or by using the keyword search tool below to find specific information within the annual report.-
 1
1 -
2
-
3
-
4
-
5
-
6
-
7
-
8
-
9
-
10
-
11
-
12
-
13
-
14
-
15
-
16
-
17
-
18
-
19
-
20
-
21
-
22
-
23
-
24
-
25
-
26
-
27
-
 28
28 -
 29
29 -
 30
30 -
 31
31 -
 32
32 -
 33
33 -
 34
34 -
 35
35 -
 36
36 -
 37
37 -
 38
38 -
 39
39 -
 40
40 -
 41
41 -
 42
42 -
 43
43 -
 44
44 -
 45
45 -
 46
46 -
 47
47 -
 48
48 -
49
-
50
-
51
-
52
-
53
-
54
-
55
-
56
-
57
-
58
-
59
-
60
-
61
-
62
-
63
-
64
-
65
-
66
-
67
-
68
-
69
-
70
-
71
-
72
-
73
-
74
-
75
-
76
-
77
-
78
-
79
-
80
-
81
-
82
-
83
-
84
-
85
-
86
-
87
-
88
-
89
-
90
-
91
-
92
-
93
-
94
-
95
-
96
-
97
-
98
-
99
-
100
-
101
-
102
-
103
-
104
-
105
-
106
-
107
-
108
-
109
-
110
-
111
-
112
-
113
-
114
-
115
-
116
-
117
-
118
-
119
-
120
-
121
-
122
-
123
-
124
-
125
-
126
-
127
-
128
-
129
-
130
-
131
-
132
-
133
-
134
-
135
-
136
-
137
-
138
-
139
-
140
-
141
-
142
-
143
-
144
-
145
-
146
-
147
-
148
-
149
-
150
-
151
-
152
-
153
-
154
-
155
-
156
-
157
-
158
-
159
-
160
-
161
-
162
-
163
-
164
-
165
-
166
-
167
-
168
-
169
-
170
-
171
-
172
-
173
-
174
-
175
-
176
-
177
-
178
-
179
-
180
-
181
-
182
-
183
-
184
-
185
-
186
-
187
-
188
-
189
-
190
-
191
-
192
-
193
-
194
 |
 |

The Company's federal tax returns for fiscal years 2004 and 2003 are currently under examination by the Internal Revenue
Service (IRS). We believe our recorded tax liabilities as of July 29, 2006 are sufficient to cover any potential assessments to be made by
the IRS upon the completion of their examinations. We will continue to monitor the progress of the IRS examinations and review our
recorded tax liabilities for potential audit assessments. Adjustments to increase or decrease the recorded tax liabilities may be required in
the future as additional facts become known.
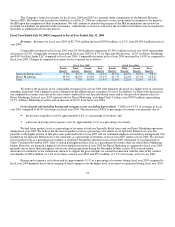
Fiscal Year Ended July 30, 2005 Compared to Fiscal Year Ended July 31, 2004
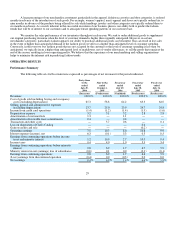
Revenues. Revenues for fiscal year 2005 of $3,774.8 million increased $290.8 million, or 8.3%, from $3,484.0 million in fiscal
year 2004.
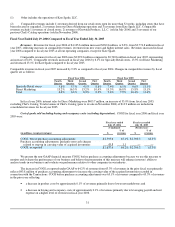
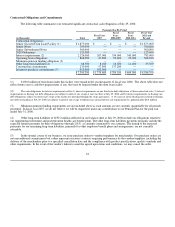
Comparable revenues for fiscal year 2005 were $3,740.6 million compared to $3,390.5 million in fiscal year 2004, representing
an increase of 9.8%. Comparable revenues increased in fiscal year 2005 by 8.7% for Specialty Retail stores, 16.3% for Direct Marketing
and 8.6% for Kate Spade LLC compared to fiscal year 2004. Comparable revenues in fiscal year 2004 increased by 14.4% as compared to
fiscal year 2003. Changes in comparable revenues by fiscal quarter are as follows:
Fiscal Year 2005 Fiscal Year 2004
Fourth
Quarter
Third
Quarter
Second
Quarter
First
Quarter
Fourth
Quarter
Third
Quarter
Second
Quarter
First
Quarter
Specialty Retail stores 7.4% 6.5% 9.6% 11.1% 11.3% 22.2% 10.2% 9.6%
Direct Marketing 19.5% 16.8% 15.8% 13.1% 21.7% 14.4% 25.7% 13.2%
Total 9.4% 7.9% 10.4% 11.4% 12.8% 22.0% 12.6% 10.7%
We believe the increases in our comparable revenues in fiscal year 2005 were primarily the result of a higher level of consumer
spending, in general, with a higher increase coming from the affluent luxury customers we serve. In addition, we believe the increases in
our comparable revenues were driven by sales events conducted by our Specialty Retail stores and by the growth of internet sales for
Direct Marketing. In fiscal year 2005, internet sales by Direct Marketing, excluding Chef's Catalog, were $305.9 million, representing
51.7% of Direct Marketing revenues and an increase of 46.0% from fiscal year 2004.
Costs of goods sold including buying and occupancy costs (excluding depreciation). COGS was 63.3% of revenues in fiscal
year 2005 compared to 64.0% of revenues in fiscal year 2004. The decrease in COGS as percentage of revenues was primarily due to:
• the decrease in product costs by approximately 0.6% as a percentage of revenues; and
• a decrease in buying and occupancy costs by approximately 0.1% as a percentage of revenues.
We had lower product costs as a percentage of revenues at both our Specialty Retail stores and our Direct Marketing operations
during fiscal year 2005. We believe the decrease in product costs as a percentage of revenues at our Specialty Retail stores was due
primarily to the higher portion of full-price sales generated in fiscal year 2005 and our continued emphasis on inventory management. Net
markdowns for Specialty Retail stores were consistent, as a percentage of revenues, in fiscal year 2005 and fiscal year 2004. We also had
lower product costs as a percentage of revenues at our Direct Marketing operation in fiscal year 2005 subsequent to our disposition of
Chef's Catalog in November 2004. Chef's Catalog had higher product costs as a percentage of revenues than our other Direct Marketing
brands. However, we incurred a higher level of net markdowns in fiscal year 2005 for Direct Marketing as compared to fiscal year 2004
primarily due to lower than anticipated sales in our catalog operations during the December holiday season. We received vendor
allowances to reimburse us for markdowns taken or to support the gross margins we earned in connection with the sales of the vendors'
merchandise of $82.8 million, or 2.2% of revenues, in fiscal year 2005 and $79.3 million, or 2.3% of revenues, in fiscal year 2004.
Buying and occupancy costs decreased by approximately 0.1% as a percentage of revenues during fiscal year 2005 compared to
fiscal year 2004 primarily due to the leveraging of fixed expenses over the higher level of revenues we generated during fiscal year 2005.
34