Neiman Marcus 2005 Annual Report Download - page 36
Download and view the complete annual report
Please find page 36 of the 2005 Neiman Marcus annual report below. You can navigate through the pages in the report by either clicking on the pages listed below, or by using the keyword search tool below to find specific information within the annual report.-
 1
1 -
2
-
3
-
4
-
5
-
6
-
7
-
8
-
9
-
10
-
11
-
12
-
13
-
14
-
15
-
16
-
17
-
18
-
19
-
20
-
21
-
22
-
23
-
24
-
25
-
 26
26 -
 27
27 -
 28
28 -
 29
29 -
 30
30 -
 31
31 -
 32
32 -
 33
33 -
 34
34 -
 35
35 -
 36
36 -
 37
37 -
 38
38 -
 39
39 -
 40
40 -
 41
41 -
 42
42 -
 43
43 -
 44
44 -
 45
45 -
 46
46 -
47
-
48
-
49
-
50
-
51
-
52
-
53
-
54
-
55
-
56
-
57
-
58
-
59
-
60
-
61
-
62
-
63
-
64
-
65
-
66
-
67
-
68
-
69
-
70
-
71
-
72
-
73
-
74
-
75
-
76
-
77
-
78
-
79
-
80
-
81
-
82
-
83
-
84
-
85
-
86
-
87
-
88
-
89
-
90
-
91
-
92
-
93
-
94
-
95
-
96
-
97
-
98
-
99
-
100
-
101
-
102
-
103
-
104
-
105
-
106
-
107
-
108
-
109
-
110
-
111
-
112
-
113
-
114
-
115
-
116
-
117
-
118
-
119
-
120
-
121
-
122
-
123
-
124
-
125
-
126
-
127
-
128
-
129
-
130
-
131
-
132
-
133
-
134
-
135
-
136
-
137
-
138
-
139
-
140
-
141
-
142
-
143
-
144
-
145
-
146
-
147
-
148
-
149
-
150
-
151
-
152
-
153
-
154
-
155
-
156
-
157
-
158
-
159
-
160
-
161
-
162
-
163
-
164
-
165
-
166
-
167
-
168
-
169
-
170
-
171
-
172
-
173
-
174
-
175
-
176
-
177
-
178
-
179
-
180
-
181
-
182
-
183
-
184
-
185
-
186
-
187
-
188
-
189
-
190
-
191
-
192
-
193
-
194
 |
 |

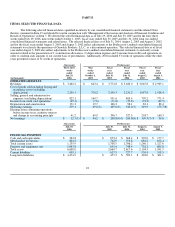
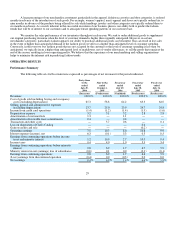
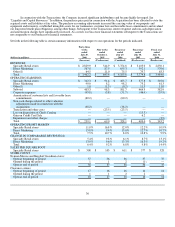
We incurred a lower level of net markdowns in our Specialty Retail stores in fiscal year 2006 primarily due to:
• higher levels of full-price selling; and
• markdown savings, primarily in the Spring season, related to lower markdown percentages taken in connection with the
end-of-season clearance activities in our full-line stores.
Consistent with industry business practice, we receive allowances from certain of our vendors in support of the merchandise we
purchase for resale. We receive certain allowances to reimburse us for markdowns taken and/or to support the gross margins realized in
connection with the sales of the vendor's merchandise. We recognize these allowances as a decrease in COGS when the allowances are
earned and approved by the vendor. Other allowances we receive represent reductions to the amounts initially paid to acquire the
merchandise. We recognize these allowances as a reduction in the cost of the acquired merchandise resulting in a decrease in COGS at the
time the goods are sold. We received vendor allowances of $88.9 million, or 2.2% of revenues, in fiscal year 2006 and $82.8 million, or
2.2% of revenues, in fiscal year 2005.
Selling, general and administrative expenses (excluding depreciation). SG&A expenses were 23.9% of revenues in fiscal year
2006 compared to 24.7% of revenues in the prior fiscal year period.
The net decrease in SG&A expenses as a percentage of revenues in fiscal year 2006 was primarily due to:
• a decrease in marketing and advertising costs of approximately 0.3% of revenues primarily due to higher internet sales by
our Direct Marketing segment, which have a lower expense to revenue ratio than catalog sales;
• a decrease of approximately 0.3% of revenues in our payroll and employee benefit costs primarily due to the leveraging of
these expenses on a higher level of revenues in fiscal year 2006 period and favorable insurance claims experience;
• lower annual incentive compensation costs of approximately 0.1% of revenues;
• a decrease in costs incurred to support our credit card operations subsequent to the Credit Card Sale of approximately 0.1%
of revenues; and
• a decrease of approximately 0.1% of revenues in professional and legal fees incurred primarily due to a higher level of costs
incurred in the fourth quarter of fiscal year 2005 related to the Transactions.
These decreases in SG&A expenses, as a percentage of revenues, were partially offset by:
• management services fees of $8.7 million, or 0.2% of revenues, payable to the Sponsors as a result of the Acquisition; and
• an increase in preopening expenses and store remodeling expenses primarily incurred in connection with the opening of our
San Antonio store in September 2005 and our Boca Raton store in November 2005 by approximately 0.1% of revenues.
Income from credit card operations. We received HSBC Program Income of $57.2 million, or 1.4% of revenues, in fiscal year
2006 compared to net finance charge income of $71.6 million, or 1.9% of revenues, in fiscal year 2005.
Depreciation expense. Depreciation expense was $130.8 million, or 3.2% of revenues, in fiscal year 2006 compared to
$106.3 million, or 2.8% of revenues, in the prior fiscal year. The increase in depreciation was primarily due to 1) a higher level of capital
spending in recent years and 2) additional depreciation expense resulting from the revaluation of our property and equipment at fair value
in connection with the Acquisition.
Amortization expense. Amortization of acquisition related intangibles (customer lists and favorable lease commitments)
recorded as a result of the application of purchase accounting in connection with the Acquisition aggregated $60.2 million, or 1.5% of
revenues, for fiscal year 2006. We had no amortization expense in the prior year period.
32