Neiman Marcus 2005 Annual Report Download - page 82
Download and view the complete annual report
Please find page 82 of the 2005 Neiman Marcus annual report below. You can navigate through the pages in the report by either clicking on the pages listed below, or by using the keyword search tool below to find specific information within the annual report.-
 1
1 -
2
-
3
-
4
-
5
-
6
-
7
-
8
-
9
-
10
-
11
-
12
-
13
-
14
-
15
-
16
-
17
-
18
-
19
-
20
-
21
-
22
-
23
-
24
-
25
-
26
-
27
-
28
-
29
-
30
-
31
-
32
-
33
-
34
-
35
-
36
-
37
-
38
-
39
-
40
-
41
-
42
-
43
-
44
-
45
-
46
-
47
-
48
-
49
-
50
-
51
-
52
-
53
-
54
-
55
-
56
-
57
-
58
-
59
-
60
-
61
-
62
-
63
-
64
-
65
-
66
-
67
-
68
-
69
-
70
-
71
-
 72
72 -
 73
73 -
 74
74 -
 75
75 -
 76
76 -
 77
77 -
 78
78 -
 79
79 -
 80
80 -
 81
81 -
 82
82 -
 83
83 -
 84
84 -
 85
85 -
 86
86 -
 87
87 -
 88
88 -
 89
89 -
 90
90 -
 91
91 -
 92
92 -
93
-
94
-
95
-
96
-
97
-
98
-
99
-
100
-
101
-
102
-
103
-
104
-
105
-
106
-
107
-
108
-
109
-
110
-
111
-
112
-
113
-
114
-
115
-
116
-
117
-
118
-
119
-
120
-
121
-
122
-
123
-
124
-
125
-
126
-
127
-
128
-
129
-
130
-
131
-
132
-
133
-
134
-
135
-
136
-
137
-
138
-
139
-
140
-
141
-
142
-
143
-
144
-
145
-
146
-
147
-
148
-
149
-
150
-
151
-
152
-
153
-
154
-
155
-
156
-
157
-
158
-
159
-
160
-
161
-
162
-
163
-
164
-
165
-
166
-
167
-
168
-
169
-
170
-
171
-
172
-
173
-
174
-
175
-
176
-
177
-
178
-
179
-
180
-
181
-
182
-
183
-
184
-
185
-
186
-
187
-
188
-
189
-
190
-
191
-
192
-
193
-
194
 |
 |
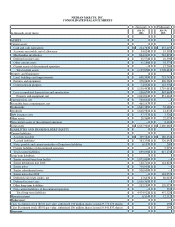
NEIMAN MARCUS, INC.
CONSOLIDATED BALANCE SHEETS
(Successor) (Predecessor)
(in thousands, except shares)
July 29,
2006
July 30,
2005
ASSETS
Current assets:
Cash and cash equivalents $ 224,763 $ 853,419
Accounts receivable, net of allowance 34,024 19,398
Merchandise inventories 804,211 742,891
Deferred income taxes 31,572 16,598
Other current assets 41,286 58,379
Current assets of discontinued operation — 17,796
Total current assets 1,135,856 1,708,481
Property and Equipment:
Land, buildings and improvements 698,399 793,745
Fixtures and equipment 378,062 806,960
Construction in progress 74,032 118,376
1,150,493 1,719,081
Less accumulated depreciation and amortization 106,679 867,665
Property and equipment, net 1,043,814 851,416
Customer lists, net 540,631 —
Favorable lease commitments, net 465,197 —
Trademarks 1,667,385 52,180
Goodwill 1,628,981 14,872
Debt issuance costs 97,537 3,526
Other assets 28,560 22,075
Non-current assets of discontinued operation — 8,110
Total assets $ 6,607,961 $ 2,660,660
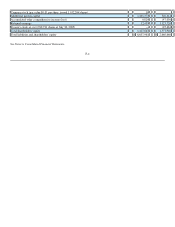
LIABILITIES AND SHAREHOLDERS' EQUITY
Current liabilities:
Accounts payable $ 309,582 $ 280,432
Accrued liabilities 383,339 326,645
Notes payable and current maturities of long-term liabilities 6,137 200
Current liabilities of discontinued operation — 9,997
Total current liabilities 699,058 617,274
Long-term liabilities:
Senior secured term loan facility 1,875,000 —
Senior debentures due 2028 120,711 124,823
Senior notes 700,000 —
Senior subordinated notes 500,000 —
Senior notes due 2008 — 124,957
Deferred real estate credits, net 27,647 86,043
Deferred income taxes 1,059,365 —
Other long-term liabilities 192,199 120,973
Non-current liabilities of discontinued operation — 532
Total long-term liabilities 4,474,922 457,328
Minority interest 6,314 12,112
Predecessor:
Class A common stock ($0.01 par value; authorized 100 million shares; issued 29,774,476 shares) 298
Class B common stock ($0.01 par value; authorized 100 million shares; issued 19,941,833 shares) 199
Successor: