Neiman Marcus 2005 Annual Report Download - page 100
Download and view the complete annual report
Please find page 100 of the 2005 Neiman Marcus annual report below. You can navigate through the pages in the report by either clicking on the pages listed below, or by using the keyword search tool below to find specific information within the annual report.-
 1
1 -
2
-
3
-
4
-
5
-
6
-
7
-
8
-
9
-
10
-
11
-
12
-
13
-
14
-
15
-
16
-
17
-
18
-
19
-
20
-
21
-
22
-
23
-
24
-
25
-
26
-
27
-
28
-
29
-
30
-
31
-
32
-
33
-
34
-
35
-
36
-
37
-
38
-
39
-
40
-
41
-
42
-
43
-
44
-
45
-
46
-
47
-
48
-
49
-
50
-
51
-
52
-
53
-
54
-
55
-
56
-
57
-
58
-
59
-
60
-
61
-
62
-
63
-
64
-
65
-
66
-
67
-
68
-
69
-
70
-
71
-
72
-
73
-
74
-
75
-
76
-
77
-
78
-
79
-
80
-
81
-
82
-
83
-
84
-
85
-
86
-
87
-
88
-
89
-
 90
90 -
 91
91 -
 92
92 -
 93
93 -
 94
94 -
 95
95 -
 96
96 -
 97
97 -
 98
98 -
 99
99 -
 100
100 -
 101
101 -
 102
102 -
 103
103 -
 104
104 -
 105
105 -
 106
106 -
 107
107 -
 108
108 -
 109
109 -
 110
110 -
111
-
112
-
113
-
114
-
115
-
116
-
117
-
118
-
119
-
120
-
121
-
122
-
123
-
124
-
125
-
126
-
127
-
128
-
129
-
130
-
131
-
132
-
133
-
134
-
135
-
136
-
137
-
138
-
139
-
140
-
141
-
142
-
143
-
144
-
145
-
146
-
147
-
148
-
149
-
150
-
151
-
152
-
153
-
154
-
155
-
156
-
157
-
158
-
159
-
160
-
161
-
162
-
163
-
164
-
165
-
166
-
167
-
168
-
169
-
170
-
171
-
172
-
173
-
174
-
175
-
176
-
177
-
178
-
179
-
180
-
181
-
182
-
183
-
184
-
185
-
186
-
187
-
188
-
189
-
190
-
191
-
192
-
193
-
194
 |
 |
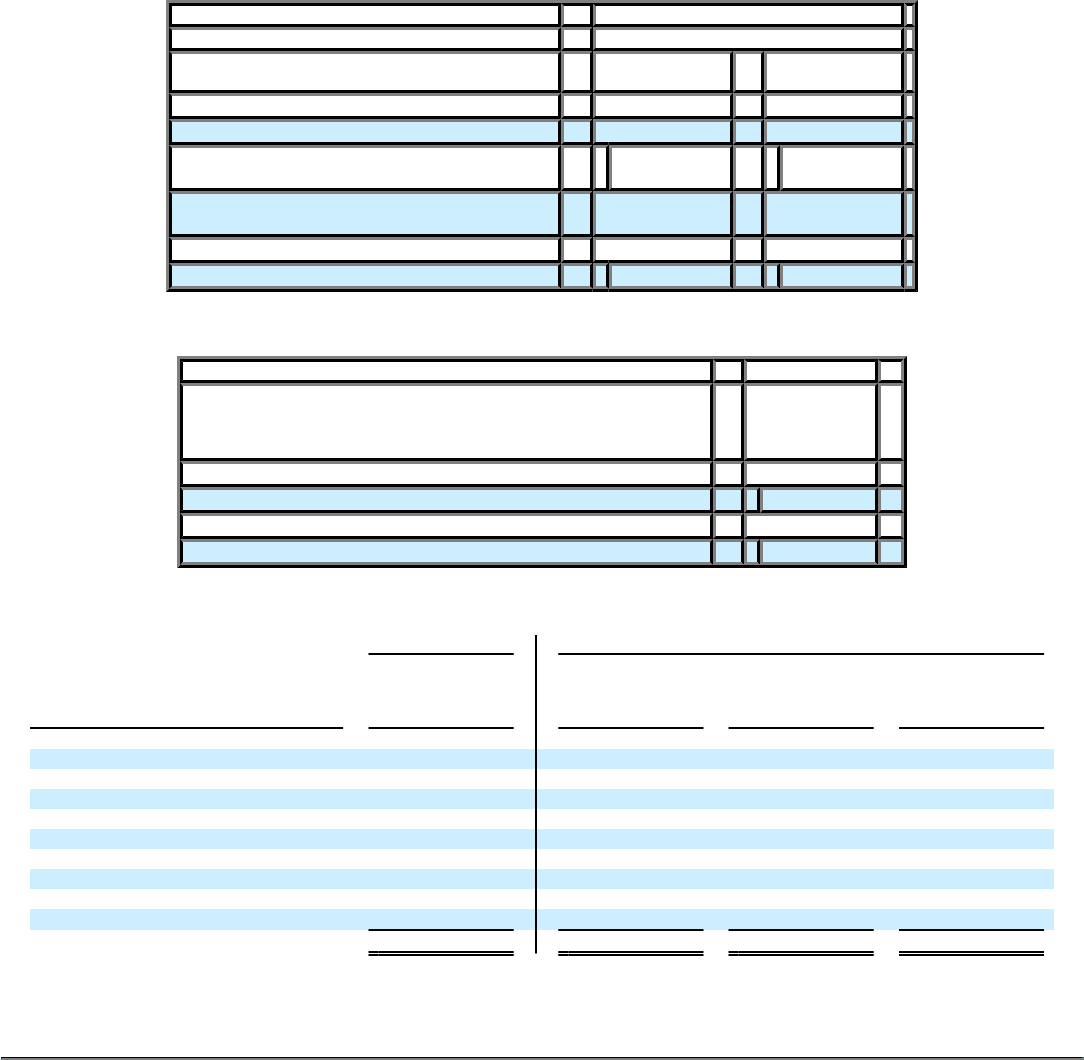
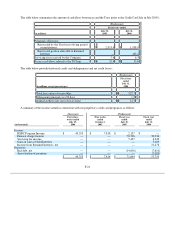
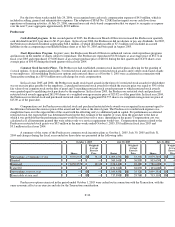
The table below summarizes the amount of cash flows between us and the Trust (prior to the Credit Card Sale in July 2005):
(Predecessor)
Fiscal years ended
(in millions)
July 30,
2005
July 31,
2004
Principal collections:
Reinvested by the Trust in revolving period
securitizations $ 2,013.4 $ 1,958.9
Reinvested portion allocable to Retained
Interests — 483.4
Servicing fees received by the Company 5.4 6.3
Excess cash flows related to the IO Strip $ 52.4 $ 53.6
The table below provides historical credit card delinquencies and net credit losses:
(Predecessor)
(in millions, except percentages)
Fiscal year
ended
July 31,
2004
Total face value of receivables $ 527.7
Delinquent principal over 90 days 1.8 %
Annual credit losses (net of recoveries) $ 14.3
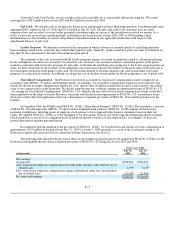
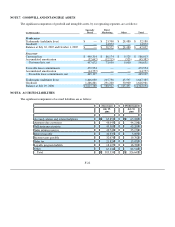
A summary of the income earned in connection with our proprietary credit card program is as follows:
(Successor) (Predecessor)
(in thousands)
Forty-three
weeks ended
July 29,
2006
Nine weeks
ended
October 1,
2005
Fiscal year
ended
July 30,
2005
Fiscal year
ended
July 31,
2004
Income:
HSBC Program Income $ 49,353 $ 7,818 $ 2,157 $ —
Finance charge income — — 78,706 39,936
Servicing fee income — — 5,437 6,340
Gain on sales of Sold Interests — — — 3,189
Income from Retained Interests, net — — — 21,478
Expenses:
Bad debt, net — — (14,656) (7,610)
Amortization of premium — — — (7,583)
$ 49,353 $ 7,818 $ 71,644 $ 55,750
F-21