Neiman Marcus 2005 Annual Report Download - page 88
Download and view the complete annual report
Please find page 88 of the 2005 Neiman Marcus annual report below. You can navigate through the pages in the report by either clicking on the pages listed below, or by using the keyword search tool below to find specific information within the annual report.-
 1
1 -
2
-
3
-
4
-
5
-
6
-
7
-
8
-
9
-
10
-
11
-
12
-
13
-
14
-
15
-
16
-
17
-
18
-
19
-
20
-
21
-
22
-
23
-
24
-
25
-
26
-
27
-
28
-
29
-
30
-
31
-
32
-
33
-
34
-
35
-
36
-
37
-
38
-
39
-
40
-
41
-
42
-
43
-
44
-
45
-
46
-
47
-
48
-
49
-
50
-
51
-
52
-
53
-
54
-
55
-
56
-
57
-
58
-
59
-
60
-
61
-
62
-
63
-
64
-
65
-
66
-
67
-
68
-
69
-
70
-
71
-
72
-
73
-
74
-
75
-
76
-
77
-
 78
78 -
 79
79 -
 80
80 -
 81
81 -
 82
82 -
 83
83 -
 84
84 -
 85
85 -
 86
86 -
 87
87 -
 88
88 -
 89
89 -
 90
90 -
 91
91 -
 92
92 -
 93
93 -
 94
94 -
 95
95 -
 96
96 -
 97
97 -
 98
98 -
99
-
100
-
101
-
102
-
103
-
104
-
105
-
106
-
107
-
108
-
109
-
110
-
111
-
112
-
113
-
114
-
115
-
116
-
117
-
118
-
119
-
120
-
121
-
122
-
123
-
124
-
125
-
126
-
127
-
128
-
129
-
130
-
131
-
132
-
133
-
134
-
135
-
136
-
137
-
138
-
139
-
140
-
141
-
142
-
143
-
144
-
145
-
146
-
147
-
148
-
149
-
150
-
151
-
152
-
153
-
154
-
155
-
156
-
157
-
158
-
159
-
160
-
161
-
162
-
163
-
164
-
165
-
166
-
167
-
168
-
169
-
170
-
171
-
172
-
173
-
174
-
175
-
176
-
177
-
178
-
179
-
180
-
181
-
182
-
183
-
184
-
185
-
186
-
187
-
188
-
189
-
190
-
191
-
192
-
193
-
194
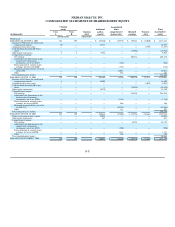
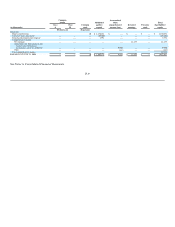
 |
 |

Common
stocks Additional
Accumulated
other Total
(in thousands)
Class
A
Class
B
Common
stock
paid-in
capital
comprehensive
income (loss)
Retained
earnings
Treasury
stock
shareholders'
equity
(Predecessor) (Successor)
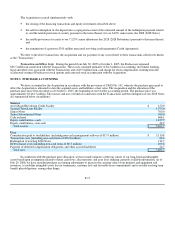
Successor:
Equity contributions 10 $ 1,470,622 $ — $ — $ — $ 1,470,632
Carryover basis adjustment — — — (69,200) — — — (69,200)
Stock based compensation expense — — — 3,951 — — — 3,951
Comprehensive income:
Net earnings — — — — — 12,455 — 12,455
Adjustments for fluctuations in fair
market value of financial
instruments, net of tax of $6,510 — — — — 9,990 — — 9,990
Other — — — — (161) — — (161)
Total comprehensive income 22,284
BALANCE AT JULY 29, 2006 — — 10 $ 1,405,373 $ 9,829 $ 12,455 $ — $ 1,427,667
See Notes to Consolidated Financial Statements.
F-9