Neiman Marcus 2005 Annual Report Download - page 37
Download and view the complete annual report
Please find page 37 of the 2005 Neiman Marcus annual report below. You can navigate through the pages in the report by either clicking on the pages listed below, or by using the keyword search tool below to find specific information within the annual report.-
 1
1 -
2
-
3
-
4
-
5
-
6
-
7
-
8
-
9
-
10
-
11
-
12
-
13
-
14
-
15
-
16
-
17
-
18
-
19
-
20
-
21
-
22
-
23
-
24
-
25
-
26
-
 27
27 -
 28
28 -
 29
29 -
 30
30 -
 31
31 -
 32
32 -
 33
33 -
 34
34 -
 35
35 -
 36
36 -
 37
37 -
 38
38 -
 39
39 -
 40
40 -
 41
41 -
 42
42 -
 43
43 -
 44
44 -
 45
45 -
 46
46 -
 47
47 -
48
-
49
-
50
-
51
-
52
-
53
-
54
-
55
-
56
-
57
-
58
-
59
-
60
-
61
-
62
-
63
-
64
-
65
-
66
-
67
-
68
-
69
-
70
-
71
-
72
-
73
-
74
-
75
-
76
-
77
-
78
-
79
-
80
-
81
-
82
-
83
-
84
-
85
-
86
-
87
-
88
-
89
-
90
-
91
-
92
-
93
-
94
-
95
-
96
-
97
-
98
-
99
-
100
-
101
-
102
-
103
-
104
-
105
-
106
-
107
-
108
-
109
-
110
-
111
-
112
-
113
-
114
-
115
-
116
-
117
-
118
-
119
-
120
-
121
-
122
-
123
-
124
-
125
-
126
-
127
-
128
-
129
-
130
-
131
-
132
-
133
-
134
-
135
-
136
-
137
-
138
-
139
-
140
-
141
-
142
-
143
-
144
-
145
-
146
-
147
-
148
-
149
-
150
-
151
-
152
-
153
-
154
-
155
-
156
-
157
-
158
-
159
-
160
-
161
-
162
-
163
-
164
-
165
-
166
-
167
-
168
-
169
-
170
-
171
-
172
-
173
-
174
-
175
-
176
-
177
-
178
-
179
-
180
-
181
-
182
-
183
-
184
-
185
-
186
-
187
-
188
-
189
-
190
-
191
-
192
-
193
-
194
 |
 |

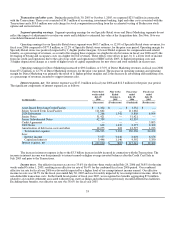
Transaction and other costs. During the period July 30, 2005 to October 1, 2005, we expensed $23.5 million in connection
with the Transactions. These costs consisted of $4.5 million of accounting, investment banking, legal and other costs associated with the
Transactions and a $19.0 million non-cash charge for stock compensation resulting from the accelerated vesting of Predecessor stock
options and restricted stock.
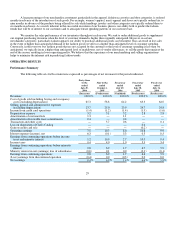
Segment operating earnings. Segment operating earnings for our Specialty Retail stores and Direct Marketing segments do not
reflect the impact of adjustments to revalue our assets and liabilities to estimated fair value at the Acquisition date. See Note 16 to our
consolidated financial statements.
Operating earnings for our Specialty Retail stores segment were $403.7 million, or 12.0% of Specialty Retail stores revenues, for
fiscal year 2006 compared to $377.8 million, or 12.2% of Specialty Retail stores revenues, for the prior year period. Operating margin for
Specialty Retail stores was positively impacted by 1) higher product margins, 2) lower SG&A expenses for compensation and related
benefits, as a percentage of revenues, as a result of leveraging these expenses on a higher level of revenues in fiscal year 2006 and 3) the
leveraging of buying and occupancy costs on a higher level of revenues. These effects were offset, in part, by 1) a lower level of income
from our credit card operations due to the sale of our credit card operations to HSBC in July 2005, 2) higher preopening costs and
3) higher depreciation charges as a result of higher levels of capital expenditures for new stores and store remodels in recent years.
Operating earnings for Direct Marketing increased to $98.2 million, or 15.0% of Direct Marketing revenues, in fiscal year 2006
from $75.2 million, or 12.7% of Direct Marketing revenues, for the prior year period. The increase in operating earnings and operating
margin for Direct Marketing was primarily the result of 1) higher product margins and 2) the decrease in advertising and marketing costs,
as a percentage of revenues, incurred to support internet sales.
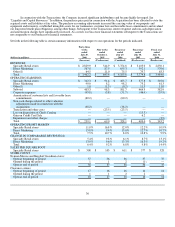
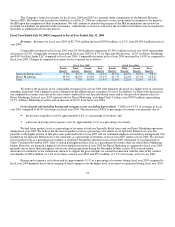
Interest expense, net. Net interest expense was $217.0 million in fiscal year 2006 and $12.3 million for the prior year period.
The significant components of interest expense are as follows:
(in thousands)
Forty-three
weeks ended
July 29,
2006
Nine weeks
Ended
October 1,
2005
Fiscal year
ended
July 29,
2006
Fiscal year
ended
July 30,
2005
(Successor) (Predecessor) (Combined) (Predecessor)
Asset-Based Revolving Credit Facility $ 1,332 $ — $ 1,332 $ —
Senior Secured Term Loan Facility 111,662 — 111,662 —
2028 Debentures 7,266 1,542 8,808 8,904
Senior Notes 51,421 — 51,421 —
Senior Subordinated Notes 42,339 — 42,339 —
Credit Agreement — — — 5,803
2008 Notes 638 1,439 2,077 8,308
Amortization of debt issue costs and other 12,275 322 12,597 1,193
Total interest expense 226,933 3,303 230,236 24,208
Less:
Interest income 5,557 3,046 8,603 6,556
Capitalized interest 3,446 1,146 4,592 5,350
Interest expense, net $ 217,930 $ (889)$ 217,041 $ 12,302
The increase in interest expense is due to the $3.3 billion increase in debt incurred in connection with the Transactions. The
increase in interest income was due primarily to interest earned on higher average invested balances after the Credit Card Sale in
July 2005 and prior to the Transactions.
Income taxes. Our effective income tax rate was 35.6% for the forty-three weeks ended July 29, 2006 and 36.8% for the nine
weeks ended October 1, 2005, resulting in an effective tax rate of 36.4% for the combined fiscal year 2006 period. Our combined
effective tax rate for fiscal year 2006 was favorably impacted by a higher level of tax-exempt interest income earned. Our effective
income tax rate was 36.7% for the fiscal year ended July 30, 2005 and was favorably impacted by tax-exempt interest income, offset by
non-deductible transaction costs. In the fourth fiscal quarter of fiscal year 2005, we recognized tax benefits aggregating $7.6 million
related to a favorable settlement associated with previous state tax filings and reductions in previously recorded deferred tax liabilities.
Excluding these benefits, our effective tax rate was 38.6% for fiscal year 2005.
33