Neiman Marcus 2005 Annual Report Download - page 39
Download and view the complete annual report
Please find page 39 of the 2005 Neiman Marcus annual report below. You can navigate through the pages in the report by either clicking on the pages listed below, or by using the keyword search tool below to find specific information within the annual report.-
 1
1 -
2
-
3
-
4
-
5
-
6
-
7
-
8
-
9
-
10
-
11
-
12
-
13
-
14
-
15
-
16
-
17
-
18
-
19
-
20
-
21
-
22
-
23
-
24
-
25
-
26
-
27
-
28
-
 29
29 -
 30
30 -
 31
31 -
 32
32 -
 33
33 -
 34
34 -
 35
35 -
 36
36 -
 37
37 -
 38
38 -
 39
39 -
 40
40 -
 41
41 -
 42
42 -
 43
43 -
 44
44 -
 45
45 -
 46
46 -
 47
47 -
 48
48 -
 49
49 -
50
-
51
-
52
-
53
-
54
-
55
-
56
-
57
-
58
-
59
-
60
-
61
-
62
-
63
-
64
-
65
-
66
-
67
-
68
-
69
-
70
-
71
-
72
-
73
-
74
-
75
-
76
-
77
-
78
-
79
-
80
-
81
-
82
-
83
-
84
-
85
-
86
-
87
-
88
-
89
-
90
-
91
-
92
-
93
-
94
-
95
-
96
-
97
-
98
-
99
-
100
-
101
-
102
-
103
-
104
-
105
-
106
-
107
-
108
-
109
-
110
-
111
-
112
-
113
-
114
-
115
-
116
-
117
-
118
-
119
-
120
-
121
-
122
-
123
-
124
-
125
-
126
-
127
-
128
-
129
-
130
-
131
-
132
-
133
-
134
-
135
-
136
-
137
-
138
-
139
-
140
-
141
-
142
-
143
-
144
-
145
-
146
-
147
-
148
-
149
-
150
-
151
-
152
-
153
-
154
-
155
-
156
-
157
-
158
-
159
-
160
-
161
-
162
-
163
-
164
-
165
-
166
-
167
-
168
-
169
-
170
-
171
-
172
-
173
-
174
-
175
-
176
-
177
-
178
-
179
-
180
-
181
-
182
-
183
-
184
-
185
-
186
-
187
-
188
-
189
-
190
-
191
-
192
-
193
-
194
 |
 |

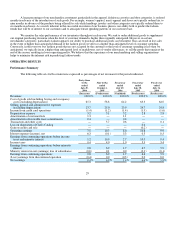
Selling, general and administrative expenses (excluding depreciation). SG&A expenses were 24.7% of revenues in fiscal year
2005 compared to 24.8% of revenues in fiscal year 2004.
The net decrease in selling, general and administrative expenses as a percentage of revenues in fiscal year 2005 as compared to
fiscal year 2004 was primarily due to:
• a decrease in marketing and advertising costs by approximately 0.3% as a percentage of revenues, primarily due to the
elimination of expenditures for Chef's Catalog which were higher as a percentage of revenues than the marketing and
advertising costs for our other Direct Marketing brands; and
• a decrease in incentive compensation by approximately 0.1% as a percentage of revenues.
These decreases in selling, general and administrative expenses as a percentage of revenues were partially offset by:
• costs, consisting primarily of legal and consulting fees, aggregating $6.7 million, or approximately 0.2% as a percentage of
revenues, incurred in connection with the Transactions;
• an increase in costs, primarily payroll, by approximately 0.1% as a percentage of revenues incurred by Direct Marketing
and Kate Spade LLC in support of new business initiatives and the expansion of Kate Spade operations; and
• an increase in employee benefit expenses, including medical and pension expenses, by approximately 0.1% as a percentage
of revenues.
In addition, selling, general and administrative expenses increased as a percentage of revenues in fiscal year 2005 due to a
$3.7 million reduction in selling, general and administrative expenses recorded in the second fiscal quarter of fiscal year 2004 for the
favorable impact of conclusions of certain sales tax and unclaimed property examinations for which the agreed-on settlements were less
than the amounts we previously estimated. We recorded no corresponding reduction in selling, general and administrative expenses in
fiscal year 2005.
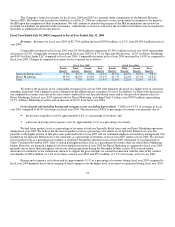
Income from credit card operations. Income from credit card operations, net was $71.6 million, or 1.9% of revenues, in fiscal
year 2005 compared to $55.7 million, or 1.6% of revenues, in fiscal year 2004. An increase in net income generated by our credit card
portfolio by approximately 0.1% as a percentage of revenues is consistent with the increase in sales made pursuant to our proprietary
credit card program. In addition, income from credit card operations, net was higher in fiscal year 2005 as compared to fiscal year 2004
by approximately 0.2% due to a $7.6 million reduction in the income generated by our credit card portfolio in fiscal year 2004 related to
the required amortization of the premium associated with the carrying value of the Retained Interests and Sold Interests during the
transition from Off-Balance Sheet Accounting to financing accounting in fiscal year 2004, as more fully described in Note 6 of the notes
to our audited consolidated financial statements. We recorded no corresponding decrease in fiscal year 2005.
Depreciation expense. Depreciation expense was $106.3 million, or 2.8% of revenues, in fiscal year 2005 compared to
$98.1 million, or 2.8% of revenues, in fiscal year 2004. Included in depreciation expense in fiscal year 2005 are unfavorable net
adjustments to depreciation aggregating approximately $5.8 million, or 0.2% of revenues, made primarily in the second and third fiscal
quarters of fiscal year 2005 in connection with our review of the amortization periods assigned to our leased property and equipment and
deferred real estate credits.
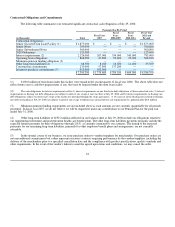
Loss on disposition of Chef's Catalog. In November 2004, we completed the Chef's Catalog Disposition. Chef's Catalog is a
multi-channel retailer of professional-quality kitchenware with revenues of approximately $73 million in fiscal year 2004. At October 30,
2004, Chef's Catalog had net tangible assets, primarily inventory, of $12.5 million and net intangible assets of $17.2 million. We received
proceeds, net of selling costs, of $14.4 million from the sale. As the carrying value of the Chef's Catalog assets exceeded the net proceeds
from the sale, we incurred a pretax loss of $15.3 million in the first fiscal quarter of fiscal year 2005 related to the Chef's Catalog
Disposition.
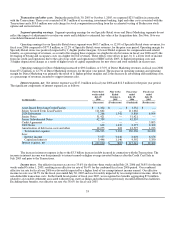
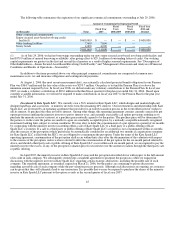
Gain on Credit Card Sale. On July 7, 2005, HSBC purchased our approximately three million private label Neiman Marcus
and Bergdorf Goodman credit card accounts and related assets, as well as the outstanding balances associated with such accounts in
connection with the Credit Card Sale. The total purchase price was approximately $647 million, consisting of approximately $534 million
in net cash proceeds and the assumption of approximately $113 million of outstanding debt under our Credit Card Facility. We
recognized a gain of $6.2 million in connection with the Credit Card Sale. Our proprietary credit card portfolio generated income,
representing primarily the excess of finance charge income, net of credit losses, of
35