Neiman Marcus 2005 Annual Report Download - page 33
Download and view the complete annual report
Please find page 33 of the 2005 Neiman Marcus annual report below. You can navigate through the pages in the report by either clicking on the pages listed below, or by using the keyword search tool below to find specific information within the annual report.-
 1
1 -
2
-
3
-
4
-
5
-
6
-
7
-
8
-
9
-
10
-
11
-
12
-
13
-
14
-
15
-
16
-
17
-
18
-
19
-
20
-
21
-
22
-
 23
23 -
 24
24 -
 25
25 -
 26
26 -
 27
27 -
 28
28 -
 29
29 -
 30
30 -
 31
31 -
 32
32 -
 33
33 -
 34
34 -
 35
35 -
 36
36 -
 37
37 -
 38
38 -
 39
39 -
 40
40 -
 41
41 -
 42
42 -
 43
43 -
44
-
45
-
46
-
47
-
48
-
49
-
50
-
51
-
52
-
53
-
54
-
55
-
56
-
57
-
58
-
59
-
60
-
61
-
62
-
63
-
64
-
65
-
66
-
67
-
68
-
69
-
70
-
71
-
72
-
73
-
74
-
75
-
76
-
77
-
78
-
79
-
80
-
81
-
82
-
83
-
84
-
85
-
86
-
87
-
88
-
89
-
90
-
91
-
92
-
93
-
94
-
95
-
96
-
97
-
98
-
99
-
100
-
101
-
102
-
103
-
104
-
105
-
106
-
107
-
108
-
109
-
110
-
111
-
112
-
113
-
114
-
115
-
116
-
117
-
118
-
119
-
120
-
121
-
122
-
123
-
124
-
125
-
126
-
127
-
128
-
129
-
130
-
131
-
132
-
133
-
134
-
135
-
136
-
137
-
138
-
139
-
140
-
141
-
142
-
143
-
144
-
145
-
146
-
147
-
148
-
149
-
150
-
151
-
152
-
153
-
154
-
155
-
156
-
157
-
158
-
159
-
160
-
161
-
162
-
163
-
164
-
165
-
166
-
167
-
168
-
169
-
170
-
171
-
172
-
173
-
174
-
175
-
176
-
177
-
178
-
179
-
180
-
181
-
182
-
183
-
184
-
185
-
186
-
187
-
188
-
189
-
190
-
191
-
192
-
193
-
194
 |
 |
A large percentage of our merchandise assortment, particularly in the apparel, fashion accessories and shoe categories, is ordered
months in advance of the introduction of such goods. For example, women's apparel, men's apparel and shoes are typically ordered six to
nine months in advance of the products being offered for sale while handbags, jewelry and other categories are typically ordered three to
six months in advance. As a result, inherent in the successful execution of our business plans is our ability both to predict the fashion
trends that will be of interest to our customers and to anticipate future spending patterns of our customer base.
We monitor the sales performance of our inventories throughout each season. We seek to order additional goods to supplement
our original purchasing decisions when the level of customer demand is higher than originally anticipated. However, in certain
merchandise categories, particularly fashion apparel, our ability to purchase additional goods can be limited. This can result in lost sales
in the event of higher than anticipated demand of the fashion goods we offer or a higher than anticipated level of consumer spending.
Conversely, in the event we buy fashion goods that are not accepted by the customer or the level of consumer spending is less than we
anticipated, we typically incur a higher than anticipated level of markdowns, net of vendor allowances, to sell the goods that remain at the
end of the season, resulting in lower operating profits. We believe that the experience of our merchandising and selling organizations
helps to minimize the inherent risk in predicting fashion trends.
OPERATING RESULTS
Performance Summary
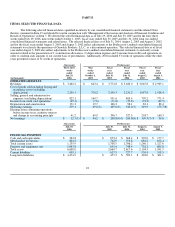
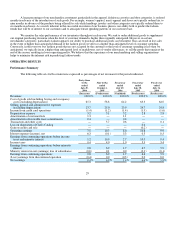
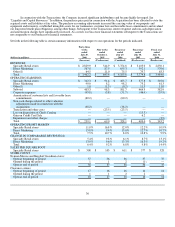
The following table sets forth certain items expressed as percentages of net revenues for the periods indicated.
Forty-three
weeks
ended
July 29,
2006
Nine weeks
ended
October 1,
2005
Fiscal year
ended
July 29,
2006
Fiscal year
ended
July 30,
2005
Fiscal year
ended
July 31,
2004
(Successor) (Predecessor) (Combined) (Predecessor) (Predecessor)
Revenues 100.0% 100.0% 100.0% 100.0% 100.0%
Cost of goods sold including buying and occupancy
costs (excluding depreciation) 65.3 58.8 64.2 63.3 64.0
Selling, general and administrative expenses
(excluding depreciation) 23.7 25.0 23.9 24.7 24.8
Income from credit card operations (1.4) (1.2) (1.4) (1.9) (1.6)
Depreciation expense 3.2 3.1 3.2 2.8 2.8
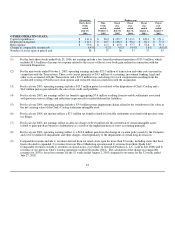
Amortization of customer lists 1.3 — 1.1 — —
Amortization of favorable lease commitments 0.4 — 0.4 — —
Transaction and other costs — 3.7 0.6 — 0.1
Loss on disposition of Chef's Catalog — — — 0.4 —
Gain on credit card sale — — — (0.2)—
Operating earnings 7.5 10.7 8.0 10.8 9.9
Interest expense (income), net 6.3 (0.1)5.3 0.3 0.5
Earnings from continuing operations before income
taxes and minority interest 1.2 10.9 2.7 10.5 9.4
Income taxes 0.4 4.0 1.0 3.9 3.4
Earnings from continuing operations before minority
interest 0.8 6.9 1.7 6.7 5.9
Minority interest in net (earnings) loss of subsidiaries (0.0)0.1 0.0 (0.1)(0.1)
Earnings from continuing operations 0.8 6.9 1.7 6.6 5.9
(Loss) earnings from discontinued operation (0.4)0.0 (0.3)0.0 0.0
Net earnings 0.4%6.9%1.4%6.6%5.9%
29