Neiman Marcus 2005 Annual Report Download - page 130
Download and view the complete annual report
Please find page 130 of the 2005 Neiman Marcus annual report below. You can navigate through the pages in the report by either clicking on the pages listed below, or by using the keyword search tool below to find specific information within the annual report.-
 1
1 -
2
-
3
-
4
-
5
-
6
-
7
-
8
-
9
-
10
-
11
-
12
-
13
-
14
-
15
-
16
-
17
-
18
-
19
-
20
-
21
-
22
-
23
-
24
-
25
-
26
-
27
-
28
-
29
-
30
-
31
-
32
-
33
-
34
-
35
-
36
-
37
-
38
-
39
-
40
-
41
-
42
-
43
-
44
-
45
-
46
-
47
-
48
-
49
-
50
-
51
-
52
-
53
-
54
-
55
-
56
-
57
-
58
-
59
-
60
-
61
-
62
-
63
-
64
-
65
-
66
-
67
-
68
-
69
-
70
-
71
-
72
-
73
-
74
-
75
-
76
-
77
-
78
-
79
-
80
-
81
-
82
-
83
-
84
-
85
-
86
-
87
-
88
-
89
-
90
-
91
-
92
-
93
-
94
-
95
-
96
-
97
-
98
-
99
-
100
-
101
-
102
-
103
-
104
-
105
-
106
-
107
-
108
-
109
-
110
-
111
-
112
-
113
-
114
-
115
-
116
-
117
-
118
-
119
-
 120
120 -
 121
121 -
 122
122 -
 123
123 -
 124
124 -
 125
125 -
 126
126 -
 127
127 -
 128
128 -
 129
129 -
 130
130 -
 131
131 -
 132
132 -
 133
133 -
 134
134 -
 135
135 -
 136
136 -
 137
137 -
 138
138 -
 139
139 -
 140
140 -
141
-
142
-
143
-
144
-
145
-
146
-
147
-
148
-
149
-
150
-
151
-
152
-
153
-
154
-
155
-
156
-
157
-
158
-
159
-
160
-
161
-
162
-
163
-
164
-
165
-
166
-
167
-
168
-
169
-
170
-
171
-
172
-
173
-
174
-
175
-
176
-
177
-
178
-
179
-
180
-
181
-
182
-
183
-
184
-
185
-
186
-
187
-
188
-
189
-
190
-
191
-
192
-
193
-
194
 |
 |

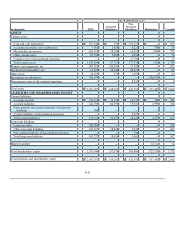
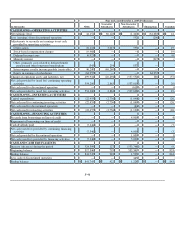
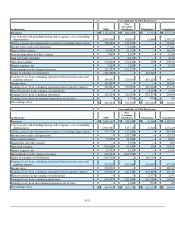
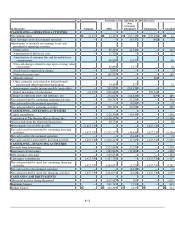
Nine weeks ended October 1, 2005 (Predecessor)
(in thousands) NMG
Guarantor
Subsidiaries
Non-Guarantor
Subsidiaries Eliminations Consolidated
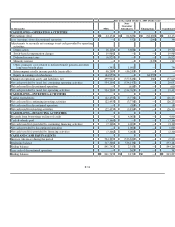
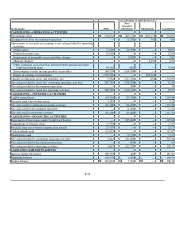
CASH FLOWS—OPERATING ACTIVITIES
Net earnings (loss) $ 44,154 $ 66,128 $ (1,440 ) $ (64,688 ) $ 44,154
Loss (earnings) from discontinued operation — — 552 (206 ) 346
Adjustments to reconcile net earnings to net cash
provided by operating activities:
Depreciation 16,118 3,015 593 — 19,726
Stock-based compensation charges 19,968 — — — 19,968
Deferred income taxes (6,921 ) — — — (6,921
Minority interest — — — (347 ) (347
Other, primarily costs related to defined benefit
pension and other long-term benefit plans (345 ) 254 837 — 746
Intercompany royalty income payable (receivable) 46,240 (46,240 ) — —
Equity in earnings of subsidiaries (64,955 ) — — 64,955
Changes in operating assets and liabilities, net 499,941 (20,294 )(537,552 )286 (57,619
Net cash provided by (used for) continuing operating
activities 554,200 2,863 (537,010 ) — 20,053
Net cash used for discontinued operation — — (618 )— (618
Net cash provided by (used for) operating activities 554,200 2,863 (537,628 )— 19,435
CASH FLOWS—INVESTING ACTIVITIES
Capital expenditures (22,455 )(2,736 )(1,040 )— (26,231
Net cash used for continuing investing activities (22,455 ) (2,736 ) (1,040 ) — (26,231
Net cash used for discontinued operation — — (80 )— (80
Net cash used for investing activities (22,455 )(2,736 )(1,120 )— (26,311
CASH FLOWS—FINANCING ACTIVITIES
Proceeds from borrowings on lines of credit — — 4,000 — 4,000
Repayment of borrowings on lines of credit — — — —
Cash dividends paid (7,346 )— — — (7,346
Net cash (used for) provided by continuing financing
activities (7,346 ) — 4,000 — (3,346
Net cash provided by discontinued operation — — 1,000 — 1,000
Net cash (used for) provided by financing activities (7,346 )— 5,000 — (2,346
CASH AND CASH EQUIVALENTS
Increase (decrease) during the period 524,399 127 (533,748 ) — (9,222
Beginning balance 317,346 795 535,341 — 853,482
Ending balance 841,745 922 1,593 — 844,260
Less cash of discontinued operation — — 365 — 365
Ending balance $ 841,745 $ 922 $ 1,228 $ — $ 843,895
F-46