Neiman Marcus 2005 Annual Report Download - page 189
Download and view the complete annual report
Please find page 189 of the 2005 Neiman Marcus annual report below. You can navigate through the pages in the report by either clicking on the pages listed below, or by using the keyword search tool below to find specific information within the annual report.-
 1
1 -
2
-
3
-
4
-
5
-
6
-
7
-
8
-
9
-
10
-
11
-
12
-
13
-
14
-
15
-
16
-
17
-
18
-
19
-
20
-
21
-
22
-
23
-
24
-
25
-
26
-
27
-
28
-
29
-
30
-
31
-
32
-
33
-
34
-
35
-
36
-
37
-
38
-
39
-
40
-
41
-
42
-
43
-
44
-
45
-
46
-
47
-
48
-
49
-
50
-
51
-
52
-
53
-
54
-
55
-
56
-
57
-
58
-
59
-
60
-
61
-
62
-
63
-
64
-
65
-
66
-
67
-
68
-
69
-
70
-
71
-
72
-
73
-
74
-
75
-
76
-
77
-
78
-
79
-
80
-
81
-
82
-
83
-
84
-
85
-
86
-
87
-
88
-
89
-
90
-
91
-
92
-
93
-
94
-
95
-
96
-
97
-
98
-
99
-
100
-
101
-
102
-
103
-
104
-
105
-
106
-
107
-
108
-
109
-
110
-
111
-
112
-
113
-
114
-
115
-
116
-
117
-
118
-
119
-
120
-
121
-
122
-
123
-
124
-
125
-
126
-
127
-
128
-
129
-
130
-
131
-
132
-
133
-
134
-
135
-
136
-
137
-
138
-
139
-
140
-
141
-
142
-
143
-
144
-
145
-
146
-
147
-
148
-
149
-
150
-
151
-
152
-
153
-
154
-
155
-
156
-
157
-
158
-
159
-
160
-
161
-
162
-
163
-
164
-
165
-
166
-
167
-
168
-
169
-
170
-
171
-
172
-
173
-
174
-
175
-
176
-
177
-
178
-
 179
179 -
 180
180 -
 181
181 -
 182
182 -
 183
183 -
 184
184 -
 185
185 -
 186
186 -
 187
187 -
 188
188 -
 189
189 -
 190
190 -
 191
191 -
 192
192 -
 193
193 -
 194
194
 |
 |
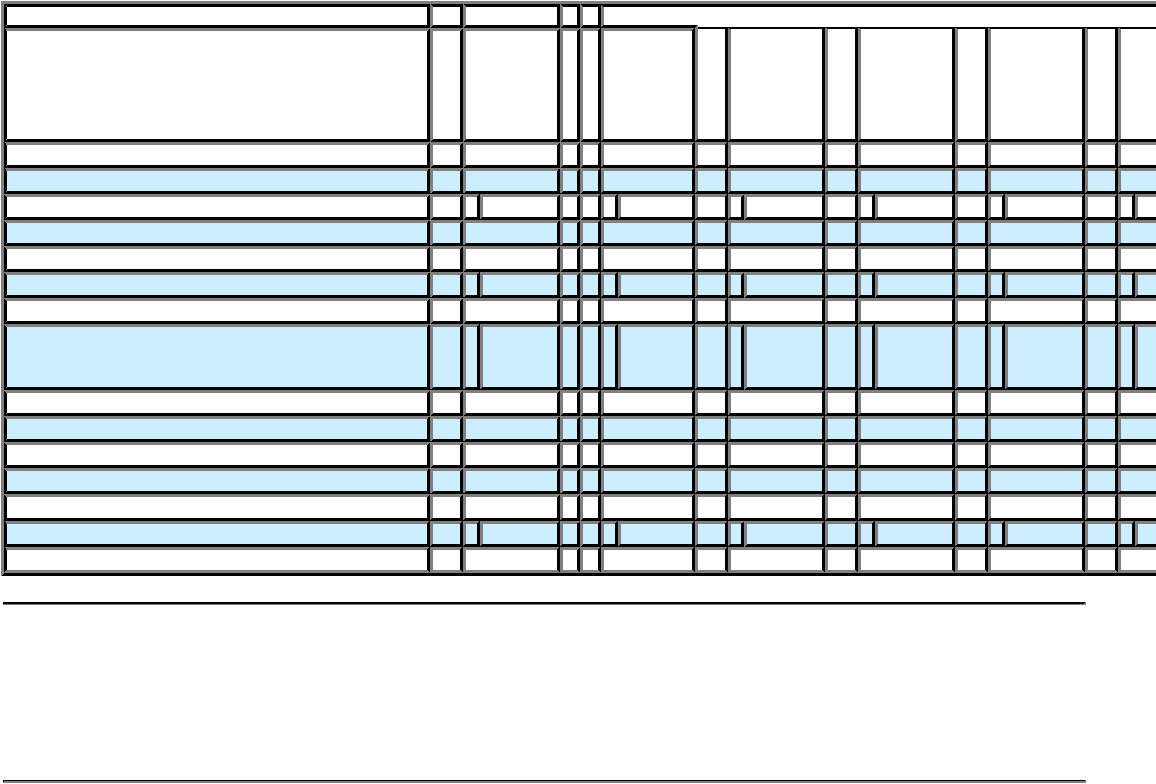
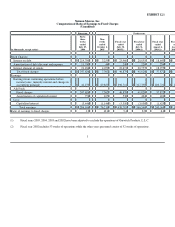
EXHIBIT 12.1
Neiman Marcus, Inc.
Computation of Ratio of Earnings to Fixed Charges
(Unaudited)
Successor Predecessor
(in thousands, except ratios)
Forty-
three
weeks
ended
July 29,
2006
Nine
weeks
ended
October 1,
2005
Fiscal year
ended
July 30,
2005(1)
Fiscal year
ended
July 31,
2004(1)
Fiscal year
ended
August 2,
2003(1)
Fiscal year
ended
August 3,
2002(1)(2)
Fixed Charges:
Interest on debt $ 214,700 $ 3,259 $ 23,960 $ 20,851 $ 18,643 $ 20,778
Amortization of debt discount and expense 11,740 44 248 220 254
Interest element of rentals 21,186 4,059 22,671 20,757 18,975 17,919
Total fixed charges $ 247,626 $ 7,362 $ 46,879 $ 41,828 $ 37,872 $ 38,948
Earnings:
Earnings from continuing operations before
income taxes, minority interest and change in
accounting principle $ 41,150 $ 69,889 $ 396,714 $ 327,330 $ 203,721 $ 160,300
Add back:
Fixed charges 247,626 7,362 46,879 41,828 37,872 38,948
Amortization of capitalized interest 776 105 538 424 401
Less:
Capitalized interest (3,446 ) (1,146 )(5,350 )(3,036 )(1,425 )(3,116
Total earnings $ 286,106 $ 76,210 $ 438,781 $ 366,546 $ 240,569 $ 196,444
Ratio of earnings to fixed charges 1.2 10.4 9.4 8.8 6.4
(1) Fiscal years 2005, 2004, 2003 and 2002 have been adjusted to exclude the operations of Gurwitch Products, L.L.C.
(2) Fiscal year 2002 includes 53 weeks of operations while the other years presented consist of 52 weeks of operations.
1