Neiman Marcus 2005 Annual Report Download - page 131
Download and view the complete annual report
Please find page 131 of the 2005 Neiman Marcus annual report below. You can navigate through the pages in the report by either clicking on the pages listed below, or by using the keyword search tool below to find specific information within the annual report.-
 1
1 -
2
-
3
-
4
-
5
-
6
-
7
-
8
-
9
-
10
-
11
-
12
-
13
-
14
-
15
-
16
-
17
-
18
-
19
-
20
-
21
-
22
-
23
-
24
-
25
-
26
-
27
-
28
-
29
-
30
-
31
-
32
-
33
-
34
-
35
-
36
-
37
-
38
-
39
-
40
-
41
-
42
-
43
-
44
-
45
-
46
-
47
-
48
-
49
-
50
-
51
-
52
-
53
-
54
-
55
-
56
-
57
-
58
-
59
-
60
-
61
-
62
-
63
-
64
-
65
-
66
-
67
-
68
-
69
-
70
-
71
-
72
-
73
-
74
-
75
-
76
-
77
-
78
-
79
-
80
-
81
-
82
-
83
-
84
-
85
-
86
-
87
-
88
-
89
-
90
-
91
-
92
-
93
-
94
-
95
-
96
-
97
-
98
-
99
-
100
-
101
-
102
-
103
-
104
-
105
-
106
-
107
-
108
-
109
-
110
-
111
-
112
-
113
-
114
-
115
-
116
-
117
-
118
-
119
-
120
-
 121
121 -
 122
122 -
 123
123 -
 124
124 -
 125
125 -
 126
126 -
 127
127 -
 128
128 -
 129
129 -
 130
130 -
 131
131 -
 132
132 -
 133
133 -
 134
134 -
 135
135 -
 136
136 -
 137
137 -
 138
138 -
 139
139 -
 140
140 -
 141
141 -
142
-
143
-
144
-
145
-
146
-
147
-
148
-
149
-
150
-
151
-
152
-
153
-
154
-
155
-
156
-
157
-
158
-
159
-
160
-
161
-
162
-
163
-
164
-
165
-
166
-
167
-
168
-
169
-
170
-
171
-
172
-
173
-
174
-
175
-
176
-
177
-
178
-
179
-
180
-
181
-
182
-
183
-
184
-
185
-
186
-
187
-
188
-
189
-
190
-
191
-
192
-
193
-
194
 |
 |
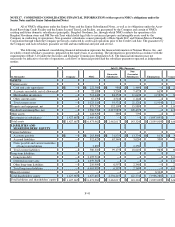
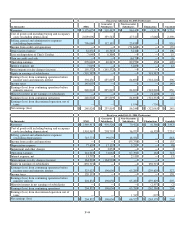
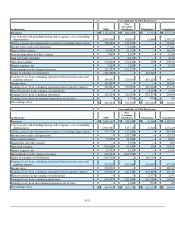
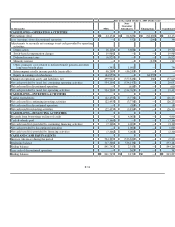
Year ended July 30, 2005 (Predecessor)
(in thousands) NMG
Guarantor
Subsidiaries
Non-
Guarantor
Subsidiaries Eliminations Consolidated
CASH FLOWS - OPERATING ACTIVITIES
Net earnings (loss) $ 248,824 $ 235,819 $ 86,244 $ (322,063 ) $ 248,824
(Earnings) loss from discontinued operation — — (1,554 ) 730 (824
Adjustments to reconcile net earnings to net cash
provided by operating activities:
Depreciation 84,831 18,301 3,214 — 106,346
Deferred income taxes (15,336 ) — — — (15,336
Loss on disposition of Chef's catalog 7,048 8,300 — — 15,348
Gain on Credit Card Sale — — (6,170 ) — (6,170
Net cash received from Credit Card Sale — — 533,656 — 533,656
Minority Interest — — — 3,107 3,107
Other, primarily costs related to defined benefit
pension and other long-term benefit plans 41,991 1,474 (3,496 ) — 39,969
Intercompany royalty income payable (receivable) 195,572 (195,572 ) — —
Equity in earnings of subsidiaries (318,382 ) — — 318,382
Changes in operating assets and liabilities, net (117,121 )(51,468 )85,766 (156 )(82,979
Net cash provided by continuing operating activities 127,427 16,854 697,660 — 841,941
Net cash provided by discontinued operation — — 3,459 — 3,459
Net cash provided by operating activities 127,427 16,854 701,119 — 845,400
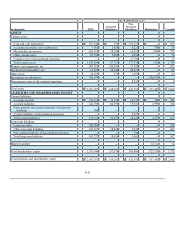
CASH FLOWS—INVESTING ACTIVITIES
Capital expenditures (173,064 ) (16,887 ) (9,747 ) — (199,698
Net increase in cash restricted for repayment of
borrowings under Credit Card Facility — — (40,713 ) — (40,713
Proceeds from the sale of Chef's Catalog 14,419 — — — 14,419
Net cash used for continuing investing activities (158,645 ) (16,887 ) (50,460 ) — (225,992
Net cash used for discontinued operation — — (2,837 )— (2,837
Net cash used for investing activities (158,645 )(16,887 )(53,297 )— (228,829
CASH FLOWS—FINANCING ACTIVITIES
Proceeds from borrowings on lines of credit — — 5,500 — 5,500
Repayment of borrowings on lines of credit (113 ) — (5,500 ) — (5,613
Repayment of borrowings under Credit Card Facility — — (112,500 ) — (112,500
Acquisitions of treasury stock (3,088 ) — — — (3,088
Proceeds from stock-based compensation awards 16,100 — — — 16,100
Cash dividends paid (27,398 ) — — — (27,398
Distributions paid — — (3,898 )— (3,898
Net cash used for continuing financing activities (14,499 ) — (116,398 ) — (130,897
Net cash used for discontinued operation — — (559 )— (559
Net cash used for financing activities (14,499 )— (116,957 )— (131,456
CASH AND CASH EQUIVALENTS
(Decrease) increase during the period (45,717 ) (33 ) 530,865 — 485,115
Beginning balance 363,063 828 4,476 — 368,367
Ending balance 317,346 795 535,341 — 853,482
Less cash of discontinued operation — — 63 —
Ending balance $ 317,346 $ 795 $ 535,278 $ — $ 853,419
F-47