Neiman Marcus 2005 Annual Report Download - page 86
Download and view the complete annual report
Please find page 86 of the 2005 Neiman Marcus annual report below. You can navigate through the pages in the report by either clicking on the pages listed below, or by using the keyword search tool below to find specific information within the annual report.-
 1
1 -
2
-
3
-
4
-
5
-
6
-
7
-
8
-
9
-
10
-
11
-
12
-
13
-
14
-
15
-
16
-
17
-
18
-
19
-
20
-
21
-
22
-
23
-
24
-
25
-
26
-
27
-
28
-
29
-
30
-
31
-
32
-
33
-
34
-
35
-
36
-
37
-
38
-
39
-
40
-
41
-
42
-
43
-
44
-
45
-
46
-
47
-
48
-
49
-
50
-
51
-
52
-
53
-
54
-
55
-
56
-
57
-
58
-
59
-
60
-
61
-
62
-
63
-
64
-
65
-
66
-
67
-
68
-
69
-
70
-
71
-
72
-
73
-
74
-
75
-
 76
76 -
 77
77 -
 78
78 -
 79
79 -
 80
80 -
 81
81 -
 82
82 -
 83
83 -
 84
84 -
 85
85 -
 86
86 -
 87
87 -
 88
88 -
 89
89 -
 90
90 -
 91
91 -
 92
92 -
 93
93 -
 94
94 -
 95
95 -
 96
96 -
97
-
98
-
99
-
100
-
101
-
102
-
103
-
104
-
105
-
106
-
107
-
108
-
109
-
110
-
111
-
112
-
113
-
114
-
115
-
116
-
117
-
118
-
119
-
120
-
121
-
122
-
123
-
124
-
125
-
126
-
127
-
128
-
129
-
130
-
131
-
132
-
133
-
134
-
135
-
136
-
137
-
138
-
139
-
140
-
141
-
142
-
143
-
144
-
145
-
146
-
147
-
148
-
149
-
150
-
151
-
152
-
153
-
154
-
155
-
156
-
157
-
158
-
159
-
160
-
161
-
162
-
163
-
164
-
165
-
166
-
167
-
168
-
169
-
170
-
171
-
172
-
173
-
174
-
175
-
176
-
177
-
178
-
179
-
180
-
181
-
182
-
183
-
184
-
185
-
186
-
187
-
188
-
189
-
190
-
191
-
192
-
193
-
194
 |
 |
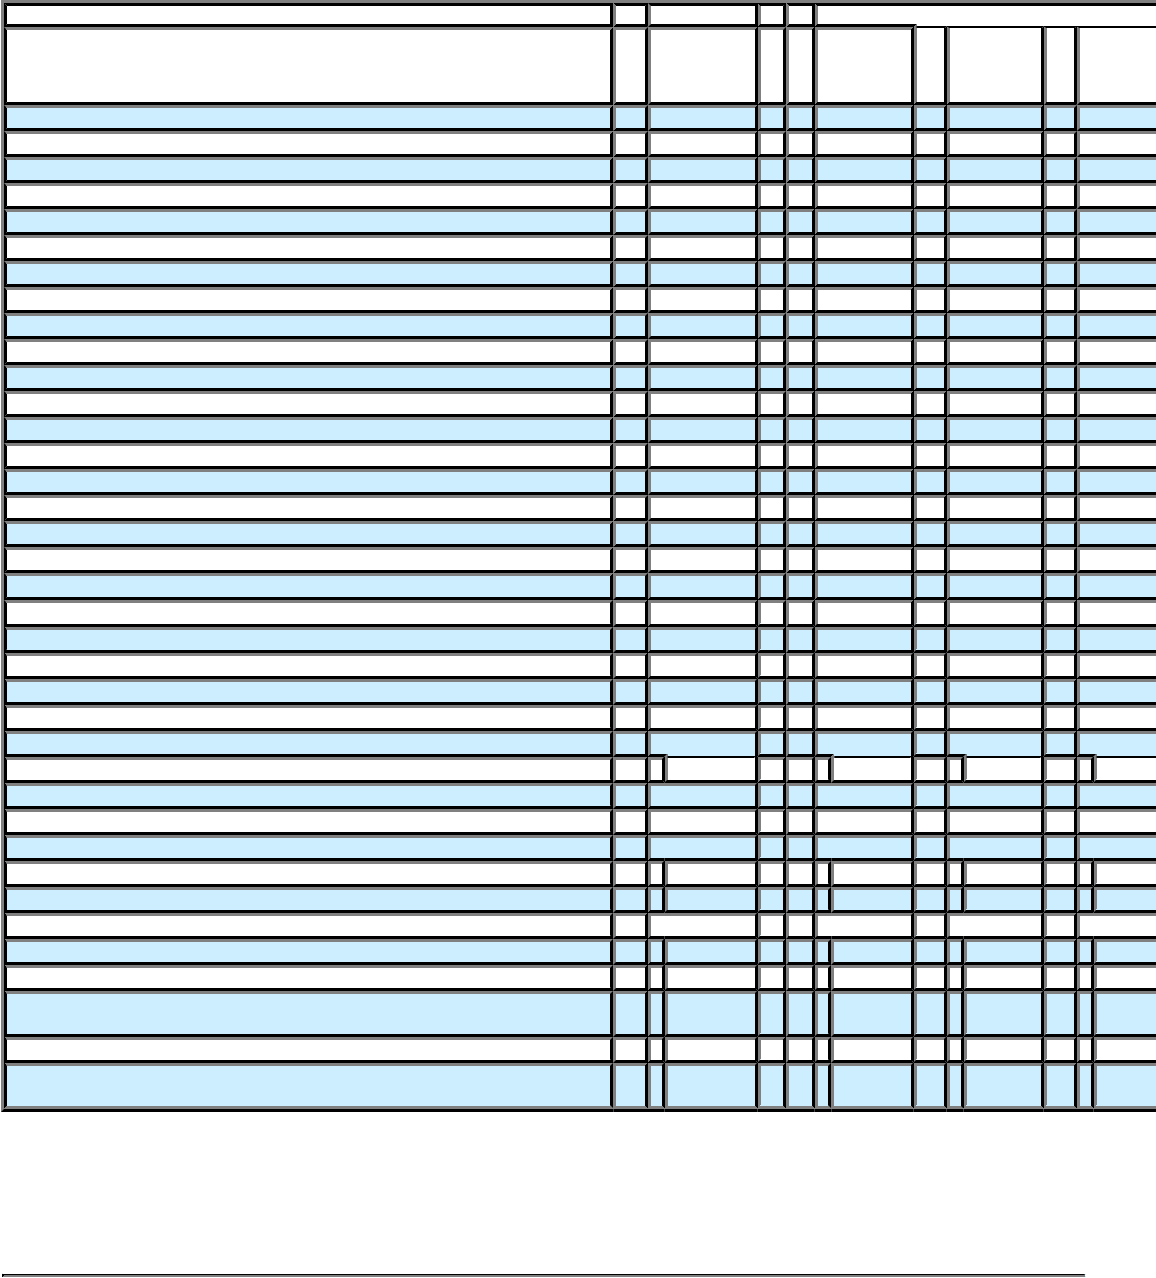
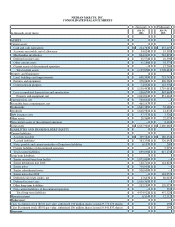
(Successor) (Predecessor)
Forty-three
weeks ended
July 29,
2006
Nine weeks
ended
October 1,
2006
Fiscal year
ended
July 30,
2005
Fiscal year
ended
July 31,
2004
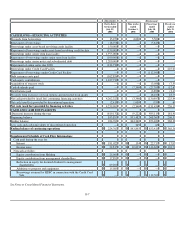
CASH FLOWS—FINANCING ACTIVITIES
Proceeds from borrowings 15,250 4,000 5,500 —
Repayment of borrowings (18,078 ) — (5,613 ) —
Borrowings under asset-based revolving credit facility 150,000 — — —
Repayment of borrowings under asset-based revolving credit facility (150,000 ) — — —
Borrowings under senior term loan facility 1,975,000 — — —
Repayment of borrowings under senior term loan facility (100,000 ) — — —
Borrowings under senior notes and subordinated debt 1,200,000 — — —
Repayment of senior notes due 2008 (134,734 ) — — —
Borrowings under Credit Card Facility — — — 225,000
Repayment of borrowings under Credit Card Facility — — (112,500 ) —
Debt issuance costs paid (102,854 ) — — —
Cash equity contributions 1,427,739 — — —
Acquisition of treasury stock — — (3,088 ) (7,553
Cash dividends paid — (7,346 ) (27,398 ) (12,632
Distributions paid — — (3,898 ) (3,172
Proceeds from exercises of stock options and restricted stock grants — — 16,100 23,797
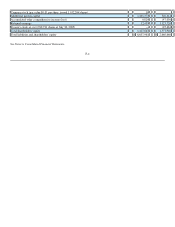
Net cash provided by (used for) continuing financing activities 4,262,323 (3,346 ) (130,897 ) 225,440
Net cash (used for) provided by discontinued operation (2,418 ) 1,000 (559 )695
Net cash (used for) provided by financing activities 4,259,905 (2,346 )(131,456 )226,135
CASH AND CASH EQUIVALENTS
(Decrease) increase during the year (619,132 ) (9,222 ) 485,115 161,417
Beginning balance 843,895 853,482 368,367 206,950
Ending balance 224,763 844,260 853,482 368,367
Less cash and cash equivalents of discontinued operation — 365 63 —
Ending balance of continuing operations $ 224,763 $ 843,895 $ 853,419 $ 368,367
Supplemental Schedule of Cash Flow Information:
Cash paid during the year for:
Interest $ 181,022 $ 134 $ 22,717 $ 17,833
Income taxes $ 22,815 $ 10,693 $ 144,626 $ 104,742
Noncash activities:
Equity contribution from Holding $ 25,000 $ — $ — $ —
Equity contribution from management shareholders $ 17,891 $ — $ — $ —
Reduction in equity for deemed dividend to management
shareholders $ 69,200 $ — $ — $ —
Additions to property and equipment $ 15,085 $ — $ — $ —
Borrowings assumed by HSBC in connection with the Credit Card
Sale $ — $ — $ 112,500 $ —
See Notes to Consolidated Financial Statements.
F-7