Neiman Marcus 2005 Annual Report Download - page 126
Download and view the complete annual report
Please find page 126 of the 2005 Neiman Marcus annual report below. You can navigate through the pages in the report by either clicking on the pages listed below, or by using the keyword search tool below to find specific information within the annual report.-
 1
1 -
2
-
3
-
4
-
5
-
6
-
7
-
8
-
9
-
10
-
11
-
12
-
13
-
14
-
15
-
16
-
17
-
18
-
19
-
20
-
21
-
22
-
23
-
24
-
25
-
26
-
27
-
28
-
29
-
30
-
31
-
32
-
33
-
34
-
35
-
36
-
37
-
38
-
39
-
40
-
41
-
42
-
43
-
44
-
45
-
46
-
47
-
48
-
49
-
50
-
51
-
52
-
53
-
54
-
55
-
56
-
57
-
58
-
59
-
60
-
61
-
62
-
63
-
64
-
65
-
66
-
67
-
68
-
69
-
70
-
71
-
72
-
73
-
74
-
75
-
76
-
77
-
78
-
79
-
80
-
81
-
82
-
83
-
84
-
85
-
86
-
87
-
88
-
89
-
90
-
91
-
92
-
93
-
94
-
95
-
96
-
97
-
98
-
99
-
100
-
101
-
102
-
103
-
104
-
105
-
106
-
107
-
108
-
109
-
110
-
111
-
112
-
113
-
114
-
115
-
 116
116 -
 117
117 -
 118
118 -
 119
119 -
 120
120 -
 121
121 -
 122
122 -
 123
123 -
 124
124 -
 125
125 -
 126
126 -
 127
127 -
 128
128 -
 129
129 -
 130
130 -
 131
131 -
 132
132 -
 133
133 -
 134
134 -
 135
135 -
 136
136 -
137
-
138
-
139
-
140
-
141
-
142
-
143
-
144
-
145
-
146
-
147
-
148
-
149
-
150
-
151
-
152
-
153
-
154
-
155
-
156
-
157
-
158
-
159
-
160
-
161
-
162
-
163
-
164
-
165
-
166
-
167
-
168
-
169
-
170
-
171
-
172
-
173
-
174
-
175
-
176
-
177
-
178
-
179
-
180
-
181
-
182
-
183
-
184
-
185
-
186
-
187
-
188
-
189
-
190
-
191
-
192
-
193
-
194
 |
 |
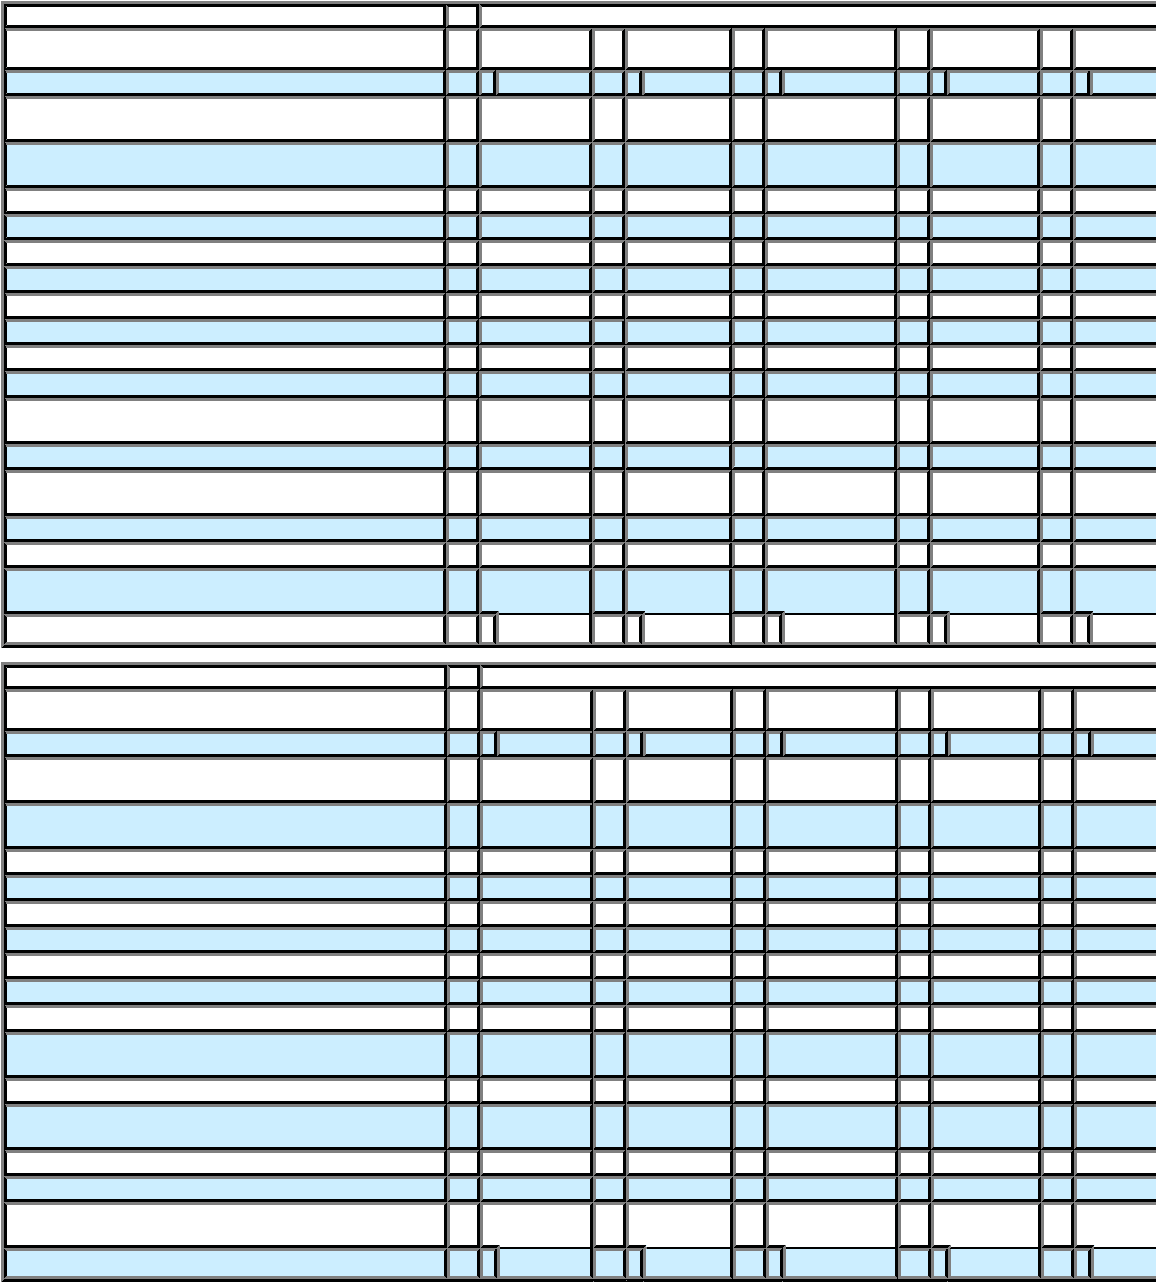
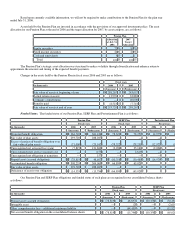
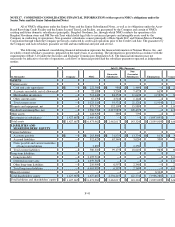
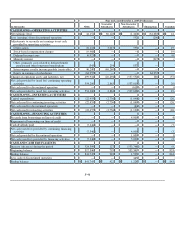
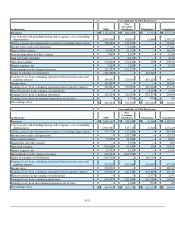
Fiscal year ended July 30, 2005 (Predecessor)
(in thousands) NMG
Guarantor
Subsidiaries
Non-Guarantor
Subsidiaries Eliminations Consolidated
Revenues $ 3,175,675 $ 518,492 $ 86,143 $ (5,512 ) $ 3,774,798
Cost of goods sold including buying and occupancy
costs (excluding depreciation) 2,009,096 339,543 47,312 (5,668 ) 2,390,283
Selling, general and administrative expenses
(excluding depreciation) 796,060 112,101 23,458 — 931,619
Income from credit card operations — — (71,644 ) — (71,644
Depreciation expense 84,831 18,301 3,214 — 106,346
Loss on disposition of Chef's Catalog 7,048 8,300 — — 15,348
Gain on credit card sale — — (6,170 )— (6,170
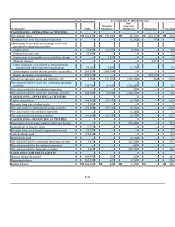
Operating earnings 278,640 40,247 89,973 156 409,016
Interest expense, net 7,019 — 5,283 — 12,302
Intercompany royalty charges (income) 195,572 (195,572 ) — —
Equity in earnings of subsidiaries (318,382 )— — 318,382
Earnings (loss) from continuing operations before
income taxes and minority interest 394,431 235,819 84,690 (318,226 ) 396,714
Income taxes 145,607 — — — 145,607
Earnings (loss) from continuing operations before
minority interest 248,824 235,819 84,690 (318,226 ) 251,107
Minority interest in net earnings of subsidiaries — — — (3,107 )(3,107
Earnings (loss) from continuing operations 248,824 235,819 84,690 (321,333 ) 248,000
Earnings (loss) from discontinued operation, net of
taxes — — 1,554 (730 )824
Net earnings (loss) $ 248,824 $ 235,819 $ 86,244 $ (322,063 )$ 248,824
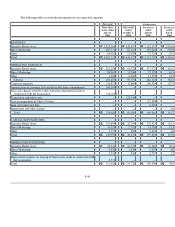
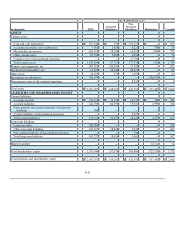
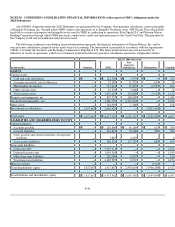
Fiscal year ended July 31, 2004 (Predecessor)
(in thousands) NMG
Guarantor
Subsidiaries
Non-Guarantor
Subsidiaries Eliminations Consolidated
Revenues $ 2,969,417 $ 450,526 $ 70,422 $ (6,366 ) $ 3,483,999
Cost of goods sold including buying and occupancy
costs (excluding depreciation) 1,901,967 298,795 36,975 (6,528 ) 2,231,209
Selling, general and administrative expenses
(excluding depreciation) 745,773 99,079 18,551 — 863,403
Income from credit card operations — — (55,750 ) — (55,750
Depreciation expense 77,659 17,137 3,255 — 98,051
Impairment and other charges — 3,853 — — 3,853
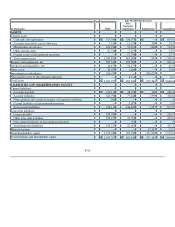
Operating earnings 244,018 31,662 67,391 162 343,233
Interest expense, net 13,792 — 2,111 — 15,903
Intercompany royalty charges (income) 164,994 (164,994 ) — —
Equity in earnings of subsidiaries (259,791 )— — 259,791
Earnings (loss) from continuing operations before
income taxes and minority interest 325,023 196,656 65,280 (259,629 ) 327,330
Income taxes 120,191 — — — 120,191
Earnings (loss) from continuing operations before
minority interest 204,832 196,656 65,280 (259,629 ) 207,139
Minority interest in net earnings of subsidiaries — — — (2,957 )(2,957
Earnings (loss) from continuing operations 204,832 196,656 65,280 (262,586 ) 204,182
Earnings (loss) from discontinued operation, net of
taxes — — 1,242 (592 )650
Net earnings (loss) $ 204,832 $ 196,656 $ 66,522 $ (263,178 )$ 204,832
F-44