Neiman Marcus 2005 Annual Report Download - page 124
Download and view the complete annual report
Please find page 124 of the 2005 Neiman Marcus annual report below. You can navigate through the pages in the report by either clicking on the pages listed below, or by using the keyword search tool below to find specific information within the annual report.-
 1
1 -
2
-
3
-
4
-
5
-
6
-
7
-
8
-
9
-
10
-
11
-
12
-
13
-
14
-
15
-
16
-
17
-
18
-
19
-
20
-
21
-
22
-
23
-
24
-
25
-
26
-
27
-
28
-
29
-
30
-
31
-
32
-
33
-
34
-
35
-
36
-
37
-
38
-
39
-
40
-
41
-
42
-
43
-
44
-
45
-
46
-
47
-
48
-
49
-
50
-
51
-
52
-
53
-
54
-
55
-
56
-
57
-
58
-
59
-
60
-
61
-
62
-
63
-
64
-
65
-
66
-
67
-
68
-
69
-
70
-
71
-
72
-
73
-
74
-
75
-
76
-
77
-
78
-
79
-
80
-
81
-
82
-
83
-
84
-
85
-
86
-
87
-
88
-
89
-
90
-
91
-
92
-
93
-
94
-
95
-
96
-
97
-
98
-
99
-
100
-
101
-
102
-
103
-
104
-
105
-
106
-
107
-
108
-
109
-
110
-
111
-
112
-
113
-
 114
114 -
 115
115 -
 116
116 -
 117
117 -
 118
118 -
 119
119 -
 120
120 -
 121
121 -
 122
122 -
 123
123 -
 124
124 -
 125
125 -
 126
126 -
 127
127 -
 128
128 -
 129
129 -
 130
130 -
 131
131 -
 132
132 -
 133
133 -
 134
134 -
135
-
136
-
137
-
138
-
139
-
140
-
141
-
142
-
143
-
144
-
145
-
146
-
147
-
148
-
149
-
150
-
151
-
152
-
153
-
154
-
155
-
156
-
157
-
158
-
159
-
160
-
161
-
162
-
163
-
164
-
165
-
166
-
167
-
168
-
169
-
170
-
171
-
172
-
173
-
174
-
175
-
176
-
177
-
178
-
179
-
180
-
181
-
182
-
183
-
184
-
185
-
186
-
187
-
188
-
189
-
190
-
191
-
192
-
193
-
194
 |
 |
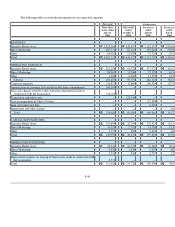
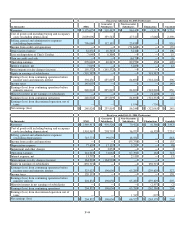
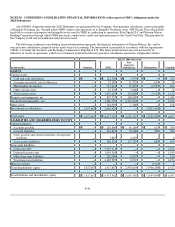
Forty-three weeks ended July 29, 2006 (Successor)
(in thousands) Company NMG
Guarantor
Subsidiaries
Non-
Guarantor
Subsidiaries Eliminations Consolidated
Revenues $ — $ 2,885,321 $ 512,007 $ 66,734 $ (1,843 ) $ 3,462,219
Cost of goods sold including buying and
occupancy costs (excluding depreciation) — 1,885,917 332,938 42,804 (2,522 ) 2,259,137
Selling, general and administrative expenses
(excluding depreciation) — 704,846 97,767 19,491 — 822,104
Income from credit card operations — (44,765 ) (4,588 ) — — (49,353
Depreciation expense — 89,545 17,028 4,513 — 111,086
Amortization of customer lists and favorable
lease commitments — 49,830 9,760 575 — 60,165
Operating earnings — 199,948 59,102 (649 ) 679 259,080
Interest expense, net — 217,664 — 266 — 217,930
Intercompany royalty charges (income) — 201,879 (201,879 ) — —
Equity in earnings of subsidiaries (12,455 )(246,686 )— — 259,141
Earnings (loss) from continuing operations
before income taxes and minority interest 12,455 27,091 260,981 (915 ) (258,462 ) 41,150
Income taxes — 14,636 — — — 14,636
Earnings (loss) from continuing operations
before minority interest 12,455 12,455 260,981 (915 ) (258,462 ) 26,514
Minority interest in net earnings of
subsidiaries — — — — (204 )
Earnings (loss) from continuing operations 12,455 12,455 260,981 (915 ) (258,666 ) 26,310
(Loss) earnings from discontinued operation,
net of taxes — — — (14,317 )462 (13,855
Net earnings (loss) $ 12,455 $ 12,455 $ 260,981 $ (15,232 )$ (258,204 )$ 12,455
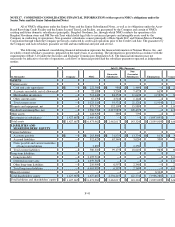
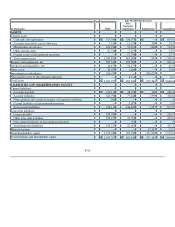
Nine weeks ended October 1, 2005 (Predecessor)
(in thousands) NMG
Guarantor
Subsidiaries
Non-
Guarantor
Subsidiaries Eliminations Consolidated
Revenues $ 530,666 $ 101,556 $ 12,283 $ (1,128 ) $ 643,377
Cost of goods sold including buying and
occupancy costs (excluding
depreciation) 312,454 58,986 7,644 (842 ) 378,242
Selling, general and administrative
expenses (excluding depreciation) 135,278 20,491 4,914 — 160,683
Income from credit card operations (6,994 ) (824 ) — — (7,818 )
Depreciation expense 16,118 3,015 593 — 19,726
Transaction and other costs 23,544 — — — 23,544
Operating earnings 50,266 19,888 (868 ) (286 ) 69,000
Interest (income) expense, net (909 ) — 20 — (889 )
Intercompany royalty charges (income) 46,240 (46,240 ) — — —
Equity in earnings of subsidiaries (64,955 )— — 64,955 —
Earnings (loss) from continuing
operations before income taxes and
minority interest 69,890 66,128 (888 ) (65,241 ) 69,889
Income taxes 25,736 — — — 25,736
Earnings (loss) from continuing
operations before minority interest 44,154 66,128 (888 ) (65,241 ) 44,153
Minority interest in net loss of
subsidiaries — — — 347 347
Earnings (loss) from continuing
operations 44,154 66,128 (888 ) (64,894 ) 44,500