Neiman Marcus 2005 Annual Report Download - page 121
Download and view the complete annual report
Please find page 121 of the 2005 Neiman Marcus annual report below. You can navigate through the pages in the report by either clicking on the pages listed below, or by using the keyword search tool below to find specific information within the annual report.-
 1
1 -
2
-
3
-
4
-
5
-
6
-
7
-
8
-
9
-
10
-
11
-
12
-
13
-
14
-
15
-
16
-
17
-
18
-
19
-
20
-
21
-
22
-
23
-
24
-
25
-
26
-
27
-
28
-
29
-
30
-
31
-
32
-
33
-
34
-
35
-
36
-
37
-
38
-
39
-
40
-
41
-
42
-
43
-
44
-
45
-
46
-
47
-
48
-
49
-
50
-
51
-
52
-
53
-
54
-
55
-
56
-
57
-
58
-
59
-
60
-
61
-
62
-
63
-
64
-
65
-
66
-
67
-
68
-
69
-
70
-
71
-
72
-
73
-
74
-
75
-
76
-
77
-
78
-
79
-
80
-
81
-
82
-
83
-
84
-
85
-
86
-
87
-
88
-
89
-
90
-
91
-
92
-
93
-
94
-
95
-
96
-
97
-
98
-
99
-
100
-
101
-
102
-
103
-
104
-
105
-
106
-
107
-
108
-
109
-
110
-
 111
111 -
 112
112 -
 113
113 -
 114
114 -
 115
115 -
 116
116 -
 117
117 -
 118
118 -
 119
119 -
 120
120 -
 121
121 -
 122
122 -
 123
123 -
 124
124 -
 125
125 -
 126
126 -
 127
127 -
 128
128 -
 129
129 -
 130
130 -
 131
131 -
132
-
133
-
134
-
135
-
136
-
137
-
138
-
139
-
140
-
141
-
142
-
143
-
144
-
145
-
146
-
147
-
148
-
149
-
150
-
151
-
152
-
153
-
154
-
155
-
156
-
157
-
158
-
159
-
160
-
161
-
162
-
163
-
164
-
165
-
166
-
167
-
168
-
169
-
170
-
171
-
172
-
173
-
174
-
175
-
176
-
177
-
178
-
179
-
180
-
181
-
182
-
183
-
184
-
185
-
186
-
187
-
188
-
189
-
190
-
191
-
192
-
193
-
194
 |
 |
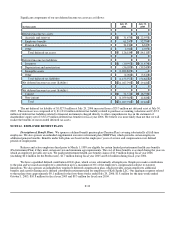
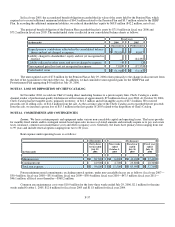
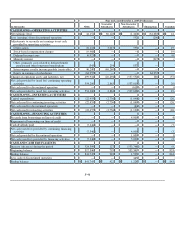
The following tables set forth the information for our reportable segments:
(Successor) (Predecessor)
Forty-three
weeks ended
July 29,
2006
Nine weeks
ended
October 1,
2005
Fiscal year
ended
July 30,
2005
Fiscal year
ended
July 31,
2004
REVENUES
Specialty Retail stores $ 2,829,966 $ 544,857 $ 3,102,952 $ 2,850,088
Direct Marketing 567,771 87,515 592,122 570,626
Other 64,482 11,005 79,724 63,285
Total $ 3,462,219 $ 643,377 $ 3,774,798 $ 3,483,999
OPERATING EARNINGS
Specialty Retail stores $ 312,296 $ 91,372 $ 377,772 $ 310,579
Direct Marketing 89,967 8,246 75,178 61,307
Other 1,024 (1,265 )11,578 10,986
Subtotal 403,287 98,353 464,528 382,872
Corporate expenses (45,857 ) (5,809 ) (46,334 ) (35,786
Amortization of customer lists and favorable lease commitments (60,165 ) — — —
Non-cash charges related to other valuation adjustments made in
connection with the Acquisition (38,185 ) — — —
Transaction and other costs — (23,544 ) — —
Loss on disposition of Chef's Catalog — — (15,348 ) —
Gain on Credit Card Sale — — 6,170 —
Impairment and other charges — — — (3,853
Total $ 259,080 $ 69,000 $ 409,016 $ 343,233
CAPITAL EXPENDITURES
Specialty Retail stores $ 123,694 $ 22,784 $ 176,519 $ 101,101
Direct Marketing 14,519 2,791 13,736 13,319
Other 2,777 656 9,443 4,649
Total $ 140,990 $ 26,231 $ 199,698 $ 119,069
DEPRECIATION EXPENSE
Specialty Retail stores $ 93,941 $ 16,970 $ 94,386 $ 88,265
Direct Marketing 9,642 1,836 9,203 8,058
Other 3,732 920 2,757 1,728
Depreciation expense on step-up of fixed assets made in connection with
the Acquisition 3,771 — — —
Total $ 111,086 $ 19,726 $ 106,346 $ 98,051
F-40