Neiman Marcus 2005 Annual Report Download - page 85
Download and view the complete annual report
Please find page 85 of the 2005 Neiman Marcus annual report below. You can navigate through the pages in the report by either clicking on the pages listed below, or by using the keyword search tool below to find specific information within the annual report.-
 1
1 -
2
-
3
-
4
-
5
-
6
-
7
-
8
-
9
-
10
-
11
-
12
-
13
-
14
-
15
-
16
-
17
-
18
-
19
-
20
-
21
-
22
-
23
-
24
-
25
-
26
-
27
-
28
-
29
-
30
-
31
-
32
-
33
-
34
-
35
-
36
-
37
-
38
-
39
-
40
-
41
-
42
-
43
-
44
-
45
-
46
-
47
-
48
-
49
-
50
-
51
-
52
-
53
-
54
-
55
-
56
-
57
-
58
-
59
-
60
-
61
-
62
-
63
-
64
-
65
-
66
-
67
-
68
-
69
-
70
-
71
-
72
-
73
-
74
-
 75
75 -
 76
76 -
 77
77 -
 78
78 -
 79
79 -
 80
80 -
 81
81 -
 82
82 -
 83
83 -
 84
84 -
 85
85 -
 86
86 -
 87
87 -
 88
88 -
 89
89 -
 90
90 -
 91
91 -
 92
92 -
 93
93 -
 94
94 -
 95
95 -
96
-
97
-
98
-
99
-
100
-
101
-
102
-
103
-
104
-
105
-
106
-
107
-
108
-
109
-
110
-
111
-
112
-
113
-
114
-
115
-
116
-
117
-
118
-
119
-
120
-
121
-
122
-
123
-
124
-
125
-
126
-
127
-
128
-
129
-
130
-
131
-
132
-
133
-
134
-
135
-
136
-
137
-
138
-
139
-
140
-
141
-
142
-
143
-
144
-
145
-
146
-
147
-
148
-
149
-
150
-
151
-
152
-
153
-
154
-
155
-
156
-
157
-
158
-
159
-
160
-
161
-
162
-
163
-
164
-
165
-
166
-
167
-
168
-
169
-
170
-
171
-
172
-
173
-
174
-
175
-
176
-
177
-
178
-
179
-
180
-
181
-
182
-
183
-
184
-
185
-
186
-
187
-
188
-
189
-
190
-
191
-
192
-
193
-
194
 |
 |
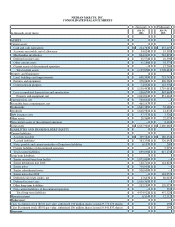
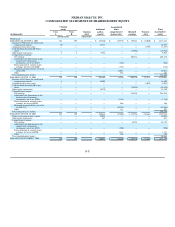
NEIMAN MARCUS, INC.
CONSOLIDATED STATEMENTS OF CASH FLOWS
(Successor) (Predecessor)
(in thousands)
Forty-three
weeks ended
July 29,
2006
Nine weeks
ended
October 1,
2005
Fiscal year
ended
July 30,
2005
Fiscal year
ended
July 31,
2004
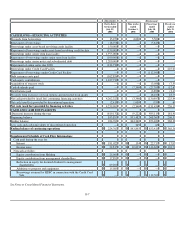
CASH FLOWS—OPERATING ACTIVITIES
Net earnings $ 12,455 $ 44,154 $ 248,824 $ 204,832
Loss (earnings) from discontinued operation 13,855 346 (824 ) (650
Adjustments to reconcile net earnings to net cash provided by operating
activities:
Depreciation 111,086 19,726 106,346 98,051
Amortization of debt issue costs 11,728 96 831 370
Amortization of customer lists and favorable lease commitments 60,165 — — —
Non-cash charges related to step-up in carrying value of inventory 38,067 — — —
Stock-based compensation charges 3,951 19,968 — —
Deferred income taxes (65,939 ) (6,921 ) (15,336 ) 22,969
Loss on disposition of Chef's Catalog — — 15,348 —
Gain on Credit Card Sale — — (6,170 ) —
Net cash received from Credit Card Sale — — 533,656 —
Impairment of intangible assets and other charges — — — 3,853
Minority interest 204 (347 ) 3,107 2,957
Other—primarily costs related to defined benefit pension and other
long-term benefit plans 15,315 650 39,138 33,510
200,887 77,672 924,920 365,892
Changes in operating assets and liabilities:
Increase in accounts receivable (7,413 ) (7,213 ) (68,781 ) (528,658
Decrease in undivided interests — — — 242,565
Decrease (increase) in merchandise inventories 111,798 (173,118 ) (39,118 ) (31,520
Decrease (increase) in other current assets 10,829 6,264 (4,641 ) 12,170
Decrease (increase) in other assets 5,627 (2,274 ) 10,743 (4,454
Increase in accounts payable and accrued liabilities 56,845 114,417 23,950 39,312
Increase in deferred real estate credits 24,334 4,305 14,868 1,556
Payment of deferred compensation and stock-based awards (12,901 ) — — —
Funding of defined benefit pension plan — — (20,000 )(45,000
Net cash provided by continuing operating activities 390,006 20,053 841,941 51,863
Net cash (used for) provided by discontinued operation (9,241 ) (618 )3,459 709
Net cash provided by operating activities 380,765 19,435 845,400 52,572
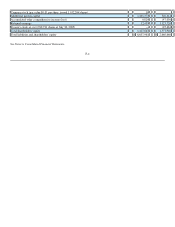
CASH FLOWS—INVESTING ACTIVITIES
Capital expenditures (140,990 ) (26,231 ) (199,698 ) (119,069
Acquisition of The Neiman Marcus Group, Inc. (5,156,423 ) — — —
Proceeds from sale of Gurwitch Products, L.L.C. 40,752 — — —
Net increase in cash restricted for repayment of borrowings under Credit
Card Facility — — (40,713 ) —
Proceeds from sale of Chef's Catalog and other assets — — 14,419 3,183
Net cash used for continuing investing activities (5,256,661 ) (26,231 ) (225,992 ) (115,886
Net cash used for discontinued operation (3,141 ) (80 )(2,837 )(1,404
Net cash used for investing activities (5,259,802 ) (26,311 )(228,829 )(117,290
F-6