Neiman Marcus 2005 Annual Report Download - page 108
Download and view the complete annual report
Please find page 108 of the 2005 Neiman Marcus annual report below. You can navigate through the pages in the report by either clicking on the pages listed below, or by using the keyword search tool below to find specific information within the annual report.-
 1
1 -
2
-
3
-
4
-
5
-
6
-
7
-
8
-
9
-
10
-
11
-
12
-
13
-
14
-
15
-
16
-
17
-
18
-
19
-
20
-
21
-
22
-
23
-
24
-
25
-
26
-
27
-
28
-
29
-
30
-
31
-
32
-
33
-
34
-
35
-
36
-
37
-
38
-
39
-
40
-
41
-
42
-
43
-
44
-
45
-
46
-
47
-
48
-
49
-
50
-
51
-
52
-
53
-
54
-
55
-
56
-
57
-
58
-
59
-
60
-
61
-
62
-
63
-
64
-
65
-
66
-
67
-
68
-
69
-
70
-
71
-
72
-
73
-
74
-
75
-
76
-
77
-
78
-
79
-
80
-
81
-
82
-
83
-
84
-
85
-
86
-
87
-
88
-
89
-
90
-
91
-
92
-
93
-
94
-
95
-
96
-
97
-
 98
98 -
 99
99 -
 100
100 -
 101
101 -
 102
102 -
 103
103 -
 104
104 -
 105
105 -
 106
106 -
 107
107 -
 108
108 -
 109
109 -
 110
110 -
 111
111 -
 112
112 -
 113
113 -
 114
114 -
 115
115 -
 116
116 -
 117
117 -
 118
118 -
119
-
120
-
121
-
122
-
123
-
124
-
125
-
126
-
127
-
128
-
129
-
130
-
131
-
132
-
133
-
134
-
135
-
136
-
137
-
138
-
139
-
140
-
141
-
142
-
143
-
144
-
145
-
146
-
147
-
148
-
149
-
150
-
151
-
152
-
153
-
154
-
155
-
156
-
157
-
158
-
159
-
160
-
161
-
162
-
163
-
164
-
165
-
166
-
167
-
168
-
169
-
170
-
171
-
172
-
173
-
174
-
175
-
176
-
177
-
178
-
179
-
180
-
181
-
182
-
183
-
184
-
185
-
186
-
187
-
188
-
189
-
190
-
191
-
192
-
193
-
194
 |
 |

hedges. As a result, changes in the fair value of NMG's swaps are recorded primarily subsequent to the effective date as a component of
other comprehensive income. For the forty-three weeks ended July 29, 2006, we recorded $10.6 million of unrecognized gains in other comprehensive
income.
At July 29, 2006, the fair value of NMG's interest rate swap agreements was a gain of approximately $20.2 million, which
amount is included in other assets. As a result of the swap agreements, NMG's effective fixed interest rates as to the $1,000.0 million in
floating rate indebtedness will range from 6.931% to 7.499% per quarter and result in an average fixed rate of 7.285%.
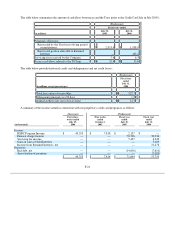
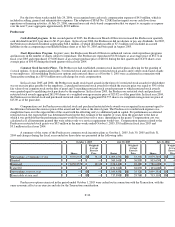
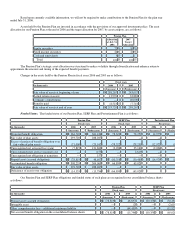
Interest expense. The significant components of interest expense are as follows:
(Successor) (Predecessor)
(in thousands)
Forty-three
weeks ended
July 29,
2006
Nine weeks
ended
October 1,
2005
Fiscal year
ended
July 30,
2005
Fiscal year
ended
July 31,
2004
Asset-Based Revolving Credit Facility $ 1,332 $ — $ — $ —
Senior Secured Term Loan Facility 111,662 — — —
2028 Debentures 7,266 1,542 8,904 8,904
Senior Notes 51,421 — — —
Senior Subordinated Notes 42,339 — — —
Credit Agreement — — 5,803 2,200
2008 Notes 638 1,439 8,308 8,308
Amortization of debt issue costs and other 12,275 322 1,193 1,659
Total interest expense 226,933 3,303 24,208 21,071
Less:
Interest income 5,557 3,046 6,556 2,132
Capitalized interest 3,446 1,146 5,350 3,036
Interest expense, net $ 217,930 $ (889)$ 12,302 $ 15,903
NOTE 10. COMMON SHAREHOLDERS' EQUITY
Successor
Carryover Basis Adjustment for Management Shareholders. Executive management participants held certain equity interests,
including stock options, in the Predecessor prior to the Transactions and continue to hold equity interests in the Company, representing
indirect equity interests in the Successor after the Transactions. In accordance with the provisions of Emerging Issues Task Force
No. 88-16, "Basis in Leveraged Buyout Transactions," the basis of executive management's indirect interests in the Successor after the
Transactions is carried over at the basis of their interests in the Predecessor prior to the Transactions. The carryover basis of such interests
less the net cash received by the management participants represents a deemed dividend of $69.2 million to the management participants
and has been recognized as a reduction to shareholders' equity.
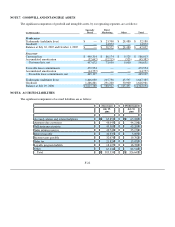
Successor Stock-Based Compensation Accounting. In connection with the Transactions, the Company authorized new equity-
based management arrangements which authorize equity awards to be granted for up to 87,992.0 shares of the common stock of the
Company, of which options for 81,716.3 shares were issued to certain management employees. All options are outstanding at July 29,
2006. Substantially all options have an exercise price of $1,445 per share, with the exercise price with respect to approximately 50% of
such options escalating at a 10% compound rate per year until the earlier to occur of (i) exercise, (ii) the fifth anniversary of the date of
grant or (iii) the occurrence of a change in control; provided that in the event the Sponsors cause the sale of shares of the Company to an
unaffiliated entity, the exercise price will cease to accrete at the time of the sale with respect to a pro rata portion of the accreting options.
Using the Black-Scholes option-pricing model, the per share fair value of these options was approximately $494 for the fixed price
options and $247 for the options with escalating exercise prices. In estimating the fair value of our options, we made the following
assumptions: expected term to exercise of five years; expected volatility of 30%; risk-free interest rate of 4.23%; and no dividend yield.
Expected volatility is based on a combination of the Predecessor's historical volatility adjusted for our new leverage and estimates of
implied volatility of our peer group. Options generally vest over four to five years and expire 10 years from the date of grant. At July 29,
2006, options for 7,283.2 shares were vested.
F-29