MetLife 2001 Annual Report Download - page 79
Download and view the complete annual report
Please find page 79 of the 2001 MetLife annual report below. You can navigate through the pages in the report by either clicking on the pages listed below, or by using the keyword search tool below to find specific information within the annual report.-
 1
1 -
2
-
3
-
4
-
5
-
6
-
7
-
8
-
9
-
10
-
11
-
12
-
13
-
14
-
15
-
16
-
17
-
18
-
19
-
20
-
21
-
22
-
23
-
24
-
25
-
26
-
27
-
28
-
29
-
30
-
31
-
32
-
33
-
34
-
35
-
36
-
37
-
38
-
39
-
40
-
41
-
42
-
43
-
44
-
45
-
46
-
47
-
48
-
49
-
50
-
51
-
52
-
53
-
54
-
55
-
56
-
57
-
58
-
59
-
60
-
61
-
62
-
63
-
64
-
65
-
66
-
67
-
68
-
 69
69 -
 70
70 -
 71
71 -
 72
72 -
 73
73 -
 74
74 -
 75
75 -
 76
76 -
 77
77 -
 78
78 -
 79
79 -
 80
80 -
 81
81
 |
 |

METLIFE, INC.
NOTES TO CONSOLIDATED FINANCIAL STATEMENTS — (Continued)
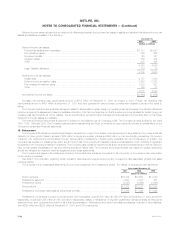
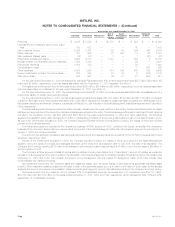
At or for the year ended December 31, 1999
Auto & Asset Corporate
Individual Institutional Reinsurance Home Management International & Other Total
(Dollars in millions)
Premiums *********************************** $ 4,289 $ 5,525 $ — $1,751 $ — $ 523 $ — $ 12,088
Universal life and investment-type product policy
fees ************************************** 888 502 — — — 43 — 1,433
Net investment income ************************ 5,346 3,755 — 103 80 206 326 9,816
Other revenues******************************* 381 609 — 21 803 12 35 1,861
Net investment (losses) gains ******************* (14) (31) — 1 — 1 (27) (70)
Policyholder benefits and claims***************** 4,625 6,712 — 1,301 — 458 4 13,100
Interest credited to policyholder account balances** 1,359 1,030 — — — 52 — 2,441
Policyholder dividends ************************* 1,509 159 — — — 22 — 1,690
Demutualization costs ************************* — — — — — — 260 260
Other expenses ****************************** 2,542 1,569 — 514 795 248 794 6,462
Income (loss) before provision for income taxes**** 855 890 — 61 88 5 (724) 1,175
Net income (loss) ***************************** 555 567 — 56 51 21 (633) 617
For the year ended December 31, 2001 the Institutional, Individual, Reinsurance and Auto & Home segments include $287 million, $24 million, $9
million and $5 million, respectively, of pre-tax losses associated with the September 11, 2001 tragedies. See Note 2.
The Institutional, Individual and Auto & Home segments include $399 million, $97 million and $3 million, respectively, in pre-tax charges associated
with business realignment initiatives for the year ended December 31, 2001. See Note 13.
For the year ended December 31, 2001, the Individual segment includes $118 million of pre-tax expenses associated with the establishment of a
policyholder liability for certain group annuity policies.
For the year ended December 31, 2001, pre-tax gross investment gains and (losses) of $1,027 million, $142 million and $(1,172) million (comprised
of a $354 million gain and an intercompany elimination of $(1,526) million), resulting from the sale of certain real estate properties from Metropolitan Life to
Metropolitan Insurance and Annuity Company, a subsidiary of MetLife, Inc., are included in the Individual segment, Institutional segment and Corporate &
Other, respectively.
The Individual segment included an equity ownership interest in Nvest under the equity method of accounting. Nvest was included within the Asset
Management segment due to the types of products and strategies employed by the entity. The Individual segment’s equity in earnings of Nvest, which is
included in net investment income, was $30 million and $48 million for the years ended December 31, 2000 and 1999, respectively. The Individual
segment includes $538 million (after allocating $118 million to participating contracts) of the pre-tax gross investment gain on the sale of Nvest in 2000.
As part of the GenAmerica acquisition in 2000, the Company acquired General American Life Insurance Company, the results of which are included
primarily in the Individual segment.
The Reinsurance segment includes the life reinsurance business of RGA, acquired in 2000, combined with Exeter, an ancillary life reinsurance
business of the Company. Exeter has been reported as a component of the Individual segment rather than as a separate segment for periods prior to
January 1, 2000 due to its immateriality.
The Auto & Home segment includes the standard personal lines property and casualty insurance operations of The St. Paul Companies which were
acquired in September 1999.
As part of the GenAmerica acquisition in 2000, the Company acquired Conning, the results of which are included in the Asset Management
segment due to the types of products and strategies employed by the entity from its acquisition date to July 2001, the date of its disposition. The
Company sold Conning, receiving $108 million in the transaction and reported a gain of approximately $16 million, net of income taxes of $9 million, in
the third quarter of 2001.
The Corporate & Other segment consists of various start-up entities, including Grand Bank, N.A. (‘‘Grand Bank’’), and run-off entities, as well as the
elimination of all intersegment amounts. In addition, the elimination of the Individual segment’s ownership interest in Nvest is included for the years ended
December 31, 2000 and 1999. The principal component of the intersegment amounts relates to intersegment loans, which bear interest rates
commensurate with related borrowings.
Net investment income and net investment gains and losses are based upon the actual results of each segment’s specifically identifiable asset
portfolio. Other costs and operating costs were allocated to each of the segments based upon: (i) a review of the nature of such costs, (ii) time studies
analyzing the amount of employee compensation costs incurred by each segment, and (iii) cost estimates included in the Company’s product pricing.
Revenues derived from any customer did not exceed 10% of consolidated revenues. Revenues from U.S. operations were $30,777 million,
$30,750 million and $24,343 million for the years ended December 31, 2001, 2000 and 1999, respectively, which represented 96%, 97% and 97%,
respectively, of consolidated revenues.
MetLife, Inc.
F-40