MetLife 2001 Annual Report Download - page 58
Download and view the complete annual report
Please find page 58 of the 2001 MetLife annual report below. You can navigate through the pages in the report by either clicking on the pages listed below, or by using the keyword search tool below to find specific information within the annual report.-
 1
1 -
2
-
3
-
4
-
5
-
6
-
7
-
8
-
9
-
10
-
11
-
12
-
13
-
14
-
15
-
16
-
17
-
18
-
19
-
20
-
21
-
22
-
23
-
24
-
25
-
26
-
27
-
28
-
29
-
30
-
31
-
32
-
33
-
34
-
35
-
36
-
37
-
38
-
39
-
40
-
41
-
42
-
43
-
44
-
45
-
46
-
47
-
 48
48 -
 49
49 -
 50
50 -
 51
51 -
 52
52 -
 53
53 -
 54
54 -
 55
55 -
 56
56 -
 57
57 -
 58
58 -
 59
59 -
 60
60 -
 61
61 -
 62
62 -
 63
63 -
 64
64 -
 65
65 -
 66
66 -
 67
67 -
 68
68 -
69
-
70
-
71
-
72
-
73
-
74
-
75
-
76
-
77
-
78
-
79
-
80
-
81
 |
 |

METLIFE, INC.
NOTES TO CONSOLIDATED FINANCIAL STATEMENTS — (Continued)
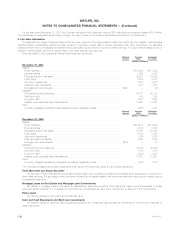
The investment amounts set forth above are generally due in monthly installments. The payment periods generally range from two to 15 years, but in
certain circumstances are as long as 30 years. These receivables are generally collateralized by the related property. The Company’s deferred tax
provision related to leveraged leases is $1,077 million and $1,040 million at December 31, 2001 and 2000, respectively.
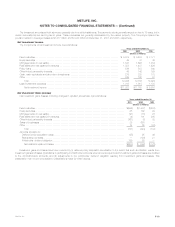
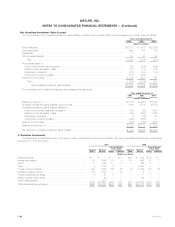
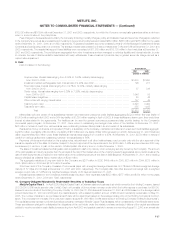
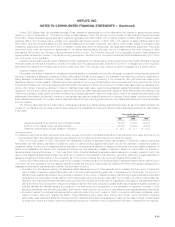
Net Investment Income
The components of net investment income were as follows:
Years ended December 31,
2001 2000 1999
(Dollars in millions)
Fixed maturities ************************************************************************* $ 8,574 $ 8,538 $ 7,171
Equity securities ************************************************************************ 49 41 40
Mortgage loans on real estate************************************************************* 1,848 1,693 1,484
Real estate and real estate joint ventures *************************************************** 1,353 1,407 1,426
Policy loans **************************************************************************** 536 515 340
Other limited partnership interests********************************************************** 48 142 199
Cash, cash equivalents and short-term investments ****************************************** 279 288 173
Other ********************************************************************************* 249 162 91
Total ****************************************************************************** 12,936 12,786 10,924
Less: Investment expenses *************************************************************** 1,013 1,018 1,108
Net investment income ************************************************************** $11,923 $11,768 $ 9,816
Net Investment Gains (Losses)
Net investment gains (losses), including changes in valuation allowances, were as follows:
Years ended December 31,
2001 2000 1999
(Dollars in millions)
Fixed maturities ****************************************************************************** $(645) $(1,437) $(538)
Equity securities****************************************************************************** 65 192 99
Mortgage loans on real estate ****************************************************************** (91) (18) 28
Real estate and real estate joint ventures********************************************************* (4) 101 265
Other limited partnership interests *************************************************************** (161) (7) 33
Sales of businesses ************************************************************************** 25 660 —
Other ************************************************************************************** 74 65 (24)
Total *********************************************************************************** (737) (444) (137)
Amounts allocable to:
Deferred policy acquisition costs************************************************************** (25) 95 46
Participating contracts*********************************************************************** — (126) 21
Policyholder dividend obligation *************************************************************** 159 85 —
Net realized investment losses ************************************************************* $(603) $ (390) $ (70)
Investment gains and losses have been reduced by (i) deferred policy acquisition amortization to the extent that such amortization results from
investment gains and losses, (ii) additions to participating contractholder accounts when amounts equal to such investment gains and losses are credited
to the contractholder’s accounts, and (iii) adjustments to the policyholder dividend obligation resulting from investment gains and losses. This
presentation may not be comparable to presentations made by other insurers.
MetLife, Inc. F-19