MetLife 2001 Annual Report Download - page 55
Download and view the complete annual report
Please find page 55 of the 2001 MetLife annual report below. You can navigate through the pages in the report by either clicking on the pages listed below, or by using the keyword search tool below to find specific information within the annual report.-
 1
1 -
2
-
3
-
4
-
5
-
6
-
7
-
8
-
9
-
10
-
11
-
12
-
13
-
14
-
15
-
16
-
17
-
18
-
19
-
20
-
21
-
22
-
23
-
24
-
25
-
26
-
27
-
28
-
29
-
30
-
31
-
32
-
33
-
34
-
35
-
36
-
37
-
38
-
39
-
40
-
41
-
42
-
43
-
44
-
 45
45 -
 46
46 -
 47
47 -
 48
48 -
 49
49 -
 50
50 -
 51
51 -
 52
52 -
 53
53 -
 54
54 -
 55
55 -
 56
56 -
 57
57 -
 58
58 -
 59
59 -
 60
60 -
 61
61 -
 62
62 -
 63
63 -
 64
64 -
 65
65 -
66
-
67
-
68
-
69
-
70
-
71
-
72
-
73
-
74
-
75
-
76
-
77
-
78
-
79
-
80
-
81
 |
 |

METLIFE, INC.
NOTES TO CONSOLIDATED FINANCIAL STATEMENTS — (Continued)
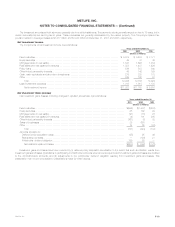
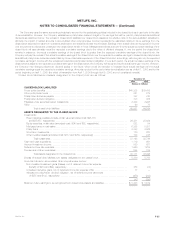
Fixed maturities and equity securities at December 31, 2000 were as follows:
Cost or Gross Unrealized
Amortized Estimated
Cost Gain Loss Fair Value
(Dollars in millions)
Fixed Maturities:
Bonds:
U.S. Treasury securities and obligations of U.S. government corporations and
agencies ************************************************************* $ 8,461 $1,189 $ 16 $ 9,634
States and political subdivisions ******************************************** 1,563 79 3 1,639
Foreign governments ***************************************************** 5,153 341 153 5,341
Corporate ************************************************************** 47,791 1,129 1,478 47,442
Mortgage- and asset-backed securities ************************************* 33,039 699 165 33,573
Other ****************************************************************** 14,974 436 381 15,029
Total bonds ********************************************************* 110,981 3,873 2,196 112,658
Redeemable preferred stocks************************************************ 321 — — 321
Total fixed maturities************************************************** $111,302 $3,873 $2,196 $112,979
Equity Securities:
Common stocks*********************************************************** $ 872 $ 785 $ 55 $ 1,602
Nonredeemable preferred stocks ********************************************* 577 19 5 591
Total equity securities************************************************* $ 1,449 $ 804 $ 60 $ 2,193
The Company held foreign currency derivatives with notional amounts of $1,925 million and $1,469 million to hedge the exchange rate risk
associated with foreign bonds at December 31, 2001 and 2000, respectively.
The Company held fixed maturities at estimated fair values that were below investment grade or not rated by an independent rating agency that
totaled $9,790 million and $9,864 million at December 31, 2001 and 2000, respectively. Non-income producing fixed maturities were insignificant.
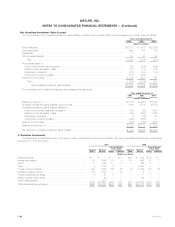
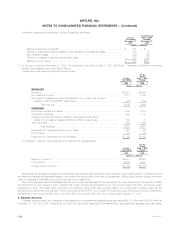
The cost or amortized cost and estimated fair value of bonds at December 31, 2001, by contractual maturity date, are shown below:
Cost or
Amortized Estimated
Cost Fair Value
(Dollars in millions)
Due in one year or less *************************************************************** $ 4,001 $ 4,049
Due after one year through five years **************************************************** 20,168 20,841
Due after five years through ten years**************************************************** 22,937 23,255
Due after ten years ******************************************************************* 30,565 32,017
Total *********************************************************************** 77,671 80,162
Mortgage- and asset-backed securities ************************************************** 33,834 34,474
Total bonds ***************************************************************** $111,505 $114,636
Bonds not due at a single maturity date have been included in the above table in the year of final maturity. Actual maturities may differ from
contractual maturities due to the exercise of prepayment options.
Sales of securities classified as available-for-sale were as follows:
Years ended December 31,
2001 2000 1999
(Dollars in millions)
Proceeds ****************************************************************************** $28,105 $46,205 $59,852
Gross investment gains ****************************************************************** $ 646 $ 599 $ 605
Gross investment losses ***************************************************************** $ 948 $ 1,520 $ 911
Gross investment losses above exclude writedowns recorded during 2001, 2000 and 1999 for other than temporarily impaired available-for-sale
securities of $278 million, $324 million and $133 million, respectively.
Excluding investments in U.S. Treasury securities and obligations of U.S. government corporations and agencies, the Company is not exposed to
any significant concentration of credit risk in its fixed maturities portfolio.
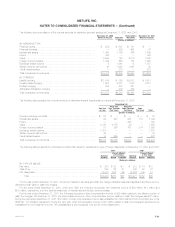
Securities Lending Program
The Company participates in securities lending programs whereby blocks of securities, which are included in investments, are loaned to third
parties, primarily major brokerage firms. The Company requires a minimum of 102% of the fair value of the loaned securities to be separately maintained
as collateral for the loans. Securities with a cost or amortized cost of $13,471 million and $11,746 million and an estimated fair value of $14,404 million
and $12,289 million were on loan under the program at December 31, 2001 and 2000, respectively. The Company was liable for cash collateral under
its control of $12,661 million and $12,301 million at December 31, 2001 and 2000, respectively. Security collateral on deposit from customers may not
be sold or repledged and is not reflected in the consolidated financial statements.
MetLife, Inc.
F-16