MetLife 2001 Annual Report Download - page 33
Download and view the complete annual report
Please find page 33 of the 2001 MetLife annual report below. You can navigate through the pages in the report by either clicking on the pages listed below, or by using the keyword search tool below to find specific information within the annual report.-
 1
1 -
2
-
3
-
4
-
5
-
6
-
7
-
8
-
9
-
10
-
11
-
12
-
13
-
14
-
15
-
16
-
17
-
18
-
19
-
20
-
21
-
22
-
 23
23 -
 24
24 -
 25
25 -
 26
26 -
 27
27 -
 28
28 -
 29
29 -
 30
30 -
 31
31 -
 32
32 -
 33
33 -
 34
34 -
 35
35 -
 36
36 -
 37
37 -
 38
38 -
 39
39 -
 40
40 -
 41
41 -
 42
42 -
 43
43 -
44
-
45
-
46
-
47
-
48
-
49
-
50
-
51
-
52
-
53
-
54
-
55
-
56
-
57
-
58
-
59
-
60
-
61
-
62
-
63
-
64
-
65
-
66
-
67
-
68
-
69
-
70
-
71
-
72
-
73
-
74
-
75
-
76
-
77
-
78
-
79
-
80
-
81
 |
 |

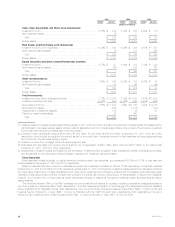
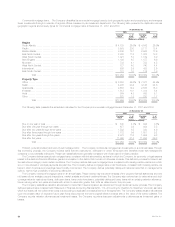
Commercial mortgage loans. The Company diversifies its commercial mortgage loans by both geographic region and property type, and manages
these investments through a network of regional offices overseen by its investment department. The following table presents the distribution across
geographic regions and property types for commercial mortgage loans at December 31, 2001 and 2000:
At December 31,
2001 2000
Carrying % of Carrying % of
Value Total Value Total
(Dollars in millions)
Region
South Atlantic ******************************************************************* $ 4,729 26.3% $ 4,542 26.9%
Pacific************************************************************************** 3,593 20.0 3,111 18.4
Middle Atlantic ******************************************************************* 3,248 18.1 2,968 17.6
East North Central**************************************************************** 2,003 11.2 1,822 10.8
West South Central*************************************************************** 1,021 5.7 1,169 6.9
New England ******************************************************************** 1,198 6.7 1,157 6.9
Mountain *********************************************************************** 733 4.1 753 4.5
West North Central *************************************************************** 727 4.0 740 4.4
International ********************************************************************* 526 2.9 433 2.6
East South Central *************************************************************** 181 1.0 174 1.0
Total ******************************************************************* $17,959 100.0% $16,869 100.0%
Property Type
Office ************************************************************************** $ 8,293 46.2% $ 7,577 44.9%
Retail*************************************************************************** 4,208 23.4 4,148 24.6
Apartments********************************************************************** 2,553 14.2 2,585 15.3
Industrial ************************************************************************ 1,813 10.1 1,414 8.4
Hotel*************************************************************************** 864 4.8 865 5.1
Other ************************************************************************** 228 1.3 280 1.7
Total ******************************************************************* $17,959 100.0% $16,869 100.0%
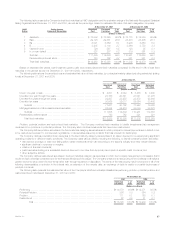
The following table presents the scheduled maturities for the Company’s commercial mortgage loans at December 31, 2001 and 2000:
At December 31,
2001 2000
Carrying % of Carrying % of
Value Total Value Total
(Dollars in millions)
Due in one year or less *********************************************************** $ 840 4.7% $ 644 3.8%
Due after one year through two years *********************************************** 677 3.8 934 5.5
Due after two years through three years ********************************************* 1,532 8.5 830 4.9
Due after three years through four years ********************************************* 1,772 9.9 1,551 9.2
Due after four years through five years *********************************************** 2,078 11.6 1,654 9.8
Due after five years *************************************************************** 11,060 61.5 11,256 66.8
Total ******************************************************************* $17,959 100.0% $16,869 100.0%
Problem, potential problem and restructured mortgage loans. The Company monitors its mortgage loan investments on a continual basis. Through
this monitoring process, the Company reviews loans that are restructured, delinquent or under foreclosure and identifies those that management
considers to be potentially delinquent. These loan classifications are generally consistent with those used in industry practice.
The Company defines restructured mortgage loans, consistent with industry practice, as loans in which the Company, for economic or legal reasons
related to the debtor’s financial difficulties, grants a concession to the debtor that it would not otherwise consider. This definition provides for loans to exit
the restructured category under certain conditions. The Company defines delinquent mortgage loans, consistent with industry practice, as loans in which
two or more interest or principal payments are past due. The Company defines mortgage loans under foreclosure, consistent with industry practice, as
loans in which foreclosure proceedings have formally commenced. The Company defines potentially delinquent loans as loans that, in management’s
opinion, have a high probability of becoming delinquent.
The Company reviews all mortgage loans on an annual basis. These reviews may include an analysis of the property financial statements and rent
roll, lease rollover analysis, property inspections, market analysis and tenant creditworthiness. The Company also reviews loan-to-value ratios and debt
coverage ratios for restructured loans, delinquent loans, loans under foreclosure, potentially delinquent loans, loans with an existing valuation allowance,
loans maturing within two years and loans with a loan-to-value ratio greater than 90% as determined in the prior year.
The Company establishes valuation allowances for loans that it deems impaired, as determined through its annual review process. The Company
defines impaired loans consistent with Statement of Financial Accounting Standards No. 114, Accounting by Creditors for Impairment of a Loan, as loans
which it probably will not collect all amounts due according to applicable contractual terms of the agreement. The Company bases valuation allowances
upon the present value of expected future cash flows discounted at the loan’s original effective interest rate or the value of the loan’s collateral. The
Company records valuation allowances as investment losses. The Company records subsequent adjustments to allowances as investment gains or
losses.
MetLife, Inc.
30