MetLife 2001 Annual Report Download - page 18
Download and view the complete annual report
Please find page 18 of the 2001 MetLife annual report below. You can navigate through the pages in the report by either clicking on the pages listed below, or by using the keyword search tool below to find specific information within the annual report.-
 1
1 -
2
-
3
-
4
-
5
-
6
-
7
-
 8
8 -
 9
9 -
 10
10 -
 11
11 -
 12
12 -
 13
13 -
 14
14 -
 15
15 -
 16
16 -
 17
17 -
 18
18 -
 19
19 -
 20
20 -
 21
21 -
 22
22 -
 23
23 -
 24
24 -
 25
25 -
 26
26 -
 27
27 -
 28
28 -
29
-
30
-
31
-
32
-
33
-
34
-
35
-
36
-
37
-
38
-
39
-
40
-
41
-
42
-
43
-
44
-
45
-
46
-
47
-
48
-
49
-
50
-
51
-
52
-
53
-
54
-
55
-
56
-
57
-
58
-
59
-
60
-
61
-
62
-
63
-
64
-
65
-
66
-
67
-
68
-
69
-
70
-
71
-
72
-
73
-
74
-
75
-
76
-
77
-
78
-
79
-
80
-
81
 |
 |

allocated to other expenses in 2000 and 1999, respectively, while the remainder of the amortization in each year is allocated to investment gains and
losses. Amortization of deferred policy acquisition costs allocated to other expenses related to insurance products decreased by $128 million to
$389 million in 2000 from $517 in 1999. This decrease is due to refinements in the calculation of estimated gross margins and profits, as well as the
acceleration of the recognition of unearned fees in connection with the product replacement program discussed above. Amortization of deferred policy
acquisition costs allocated to other expenses related to annuity and investment products increased by $88 million to $196 million in 2000 from
$108 million in 1999. This increase is primarily due to refinements in the calculation of estimated gross profits.
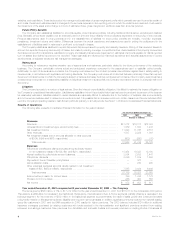
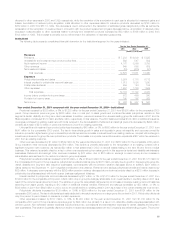
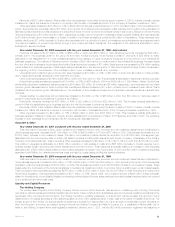
Institutional
The following table presents consolidated financial information for the Institutional segment for the years indicated:
For the Year Ended December 31,
2001 2000 1999
(Dollars in millions)
Revenues
Premiums*********************************************************************** $ 7,288 $ 6,900 $ 5,525
Universal life and investment-type product policy fees ********************************** 592 547 502
Net investment income *********************************************************** 4,161 3,959 3,755
Other revenues ****************************************************************** 649 650 609
Net investment losses ************************************************************ (15) (475) (31)
Total revenues *************************************************************** 12,675 11,581 10,360
Expenses
Policyholder benefits and claims **************************************************** 8,924 8,178 6,712
Interest credited to policyholder account balances ************************************* 1,013 1,090 1,030
Policyholder dividends ************************************************************ 259 124 159
Other expenses ***************************************************************** 1,907 1,730 1,569
Total expenses ************************************************************** 12,103 11,122 9,470
Income before provision for income taxes ******************************************** 572 459 890
Provision for income taxes********************************************************* 190 152 323
Net income ********************************************************************* $ 382 $ 307 $ 567
Year ended December 31, 2001 compared with the year ended December 31, 2000—Institutional
Premiums increased by $388 million, or 6%, to $7,288 million for the year ended December 31, 2001 from $6,900 million for the comparable 2000
period. Group insurance premiums grew by $680 million, due, in most part, to sales growth and continued favorable policyholder retention in this
segment’s dental, disability and long-term care businesses. In addition, premiums received from several existing group life customers in 2001 and the
BMA acquisition contributed $173 million and $29 million, respectively, to this variance. The 2000 balance includes $124 million in additional insurance
coverages purchased by existing customers with funds received in the demutualization. Retirement and savings premiums decreased by $292 million,
primarily as a result of $270 million in premiums received in 2000 from existing customers.
Universal life and investment-type product policy fees increased by $45 million, or 8%, to $592 million for the year ended December 31, 2001 from
$547 million for the comparable 2000 period. The rise in fees reflects growth in sales and deposits in group universal life and corporate-owned life
insurance products. Higher fees in group universal life products represent an increase in insured lives for an existing customer, coupled with a change in
a customer preference for group life over optional term products. The increase in corporate-owned life insurance represents a $27 million fee received in
2001 from an existing customer.
Other revenues decreased by $1 million to $649 million for the year ended December 31, 2001 from $650 million for the comparable 2000 period.
Group insurance other revenues decreased by $19 million. This decline is primarily attributable to the renegotiation of an existing contract with a
significant long-term care customer, as well as $20 million in final settlements in 2000 on several cases relating to the term life and former medical
business. This variance is partially offset by a rise in other revenues stemming from sales growth in this segment’s dental and disability administrative
businesses. Retirement and savings’ other revenues increased by $18 million, due to $12 million in earnings on seed money and an increase in
administrative services fees for the defined contribution group businesses.
Policyholder benefits and claims increased by $746 million, or 9%, to $8,924 million for the year ended December 31, 2001 from $8,178 million for
the comparable 2000 period. Group insurance policyholder benefits and claims grew by $778 million, primarily due to growth in this segment’s group life,
dental, disability and long-term care insurance businesses, commensurate with the premium variance discussed above. In addition, $291 million in
claims related to the September 11, 2001 tragedies contributed to this variance. Retirement and savings policyholder benefits and claims declined by
$32 million. A decrease commensurate with the $292 million premium variance discussed above is almost entirely offset by a $215 million increase in
policyholder benefits associated with fourth quarter business realignment initiatives.
Interest credited to policyholder account balances decreased by $77 million, or 7%, to $1,013 million for the year ended December 31, 2001 from
$1,090 million for the comparable 2000 period. A $24 million drop in group life is largely attributable to an overall decline in crediting rates in 2001 as a
result of the current interest rate environment. The variance in group life was partially dampened by an increase in average customer account balances
stemming from asset growth, resulting in $12 million in additional interest credited. Retirement and savings decreased by $53 million, or 9%, to
$549 million in 2001 from $602 million in 2000, due to an overall decline in crediting rates in 2001 as a result of the current interest rate environment.
Policyholder dividends increased by $135 million, or 109%, to $259 million for the year ended December 31, 2001 from $124 million for the
comparable 2000 period. The rise in dividends is primarily attributed to favorable experience on a large group life contract in 2001. Policyholder dividends
vary from period to period based on insurance contract experience.
Other expenses increased by $177 million, or 10%, to $1,907 million for the year ended December 31, 2001 from $1,730 million for the
comparable 2000 period. Group insurance expenses grew by $94 million due primarily to a rise in non-deferrable variable expenses associated with
premium growth. Non-deferrable variable expenses include premium tax, commissions and administrative expenses for dental, disability and long-term
care businesses. This variance is partially offset by a decline in rebate expenses associated with the Company’s securities lending program. The income
MetLife, Inc. 15