MetLife 2001 Annual Report Download - page 29
Download and view the complete annual report
Please find page 29 of the 2001 MetLife annual report below. You can navigate through the pages in the report by either clicking on the pages listed below, or by using the keyword search tool below to find specific information within the annual report.-
 1
1 -
2
-
3
-
4
-
5
-
6
-
7
-
8
-
9
-
10
-
11
-
12
-
13
-
14
-
15
-
16
-
17
-
18
-
 19
19 -
 20
20 -
 21
21 -
 22
22 -
 23
23 -
 24
24 -
 25
25 -
 26
26 -
 27
27 -
 28
28 -
 29
29 -
 30
30 -
 31
31 -
 32
32 -
 33
33 -
 34
34 -
 35
35 -
 36
36 -
 37
37 -
 38
38 -
 39
39 -
40
-
41
-
42
-
43
-
44
-
45
-
46
-
47
-
48
-
49
-
50
-
51
-
52
-
53
-
54
-
55
-
56
-
57
-
58
-
59
-
60
-
61
-
62
-
63
-
64
-
65
-
66
-
67
-
68
-
69
-
70
-
71
-
72
-
73
-
74
-
75
-
76
-
77
-
78
-
79
-
80
-
81
 |
 |

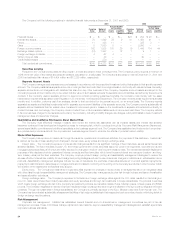
2001 2000 1999
Yield(1) Amount Yield(1) Amount Yield(1) Amount
(Dollars in millions)
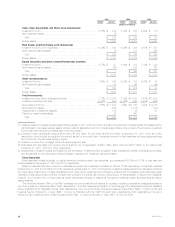
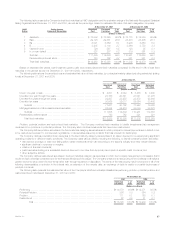
Cash, Cash Equivalents and Short-term Investments:
Investment income ************************************************ 5.54% $ 279 5.72% $ 288 4.22% $ 173
Net investment losses ********************************************* (5) — —
Total ********************************************************** $ 274 $ 288 $ 173
Ending assets **************************************************** $ 8,676 $ 4,703 $ 5,844
Real Estate and Real Estate Joint Ventures:(4)
Investment income, net of expenses ********************************* 10.58% $ 584 11.09% $ 629 9.67% $ 581
Net investment gains (losses) *************************************** (4) 101 265
Total ********************************************************** $ 580 $ 730 $ 846
Ending assets **************************************************** $ 5,730 $ 5,504 $ 5,649
Equity Securities and Other Limited Partnership Interests:
Investment income ************************************************ 2.37% $ 97 4.98% $ 183 7.12% $ 239
Net investment gains (losses) *************************************** (96) 185 132
Total ********************************************************** $ 1 $ 368 $ 371
Ending assets **************************************************** $ 4,700 $ 3,845 $ 3,337
Other Invested Assets:
Investment income ************************************************ 7.60% $ 249 6.30% $ 162 6.01% $ 91
Net investment gains (losses) *************************************** 79 65 (24)
Total ********************************************************** $ 328 $ 227 $ 67
Ending assets **************************************************** $ 3,298 $ 2,821 $ 1,501
Total Investments:
Investment income before expenses and fees ************************* 7.72% $ 12,167 7.70% $12,008 7.47% $10,079
Investment expenses and fees ************************************** (0.16%) (244) (0.16%) (240) (0.20%) (263)
Net investment income********************************************* 7.56% $ 11,923 7.54% $11,768 7.27% $ 9,816
Net investment losses ********************************************* (762) (1,104) (137)
Adjustments to investment losses(5)********************************** 134 54 67
Gains from sales of subsidiaries ************************************* 25 660 —
Total ********************************************************** $ 11,320 $11,378 $ 9,746
(1) Yields are based on quarterly average asset carrying values for 2001, 2000 and 1999, excluding recognized and unrealized gains and losses, and for
yield calculation purposes, average assets exclude collateral associated with the Company’s securities lending program. Fixed maturity investment
income has been reduced by rebates paid under the program.
(2) Included in fixed maturities are equity-linked notes of $1,004 million, $1,232 million and $1,079 million at December 31, 2001, 2000 and 1999,
respectively, which include an equity-like component as part of the notes’ return. Investment income for fixed maturities includes prepayment fees
and income from the securities lending program.
(3) Investment income from mortgage loans includes prepayment fees.
(4) Real estate and real estate joint venture income is shown net of depreciation of $220 million, $224 million and $247 million for the years ended
December 31, 2001, 2000 and 1999, respectively.
(5) Adjustments to investment gains and losses include amortization of deferred policy acquisition costs, charges and credits to participating contracts,
and adjustments to the policyholder dividend obligation resulting from investment gains and losses.
Fixed Maturities
Fixed maturities consist principally of publicly traded and privately placed debt securities, and represented 68.0% and 70.7% of total cash and
invested assets at December 31, 2001 and 2000, respectively.
Based on estimated fair value, public fixed maturities and private fixed maturities comprised 83.7% and 16.3%, respectively, of total fixed maturities
at December 31, 2001 and 83.6% and 16.4%, respectively, at December 31, 2000. The Company invests in privately placed fixed maturities to enhance
the overall value of its portfolio, increase diversification and obtain higher yields than can ordinarily be obtained with comparable public market securities.
Generally, private placements provide the Company with protective covenants, call protection features and, where applicable, a higher level of collateral.
However, the Company may not freely trade its private placements because of restrictions imposed by federal and state securities laws and illiquid
trading markets.
The Securities Valuation Office of the NAIC evaluates the bond investments of insurers for regulatory reporting purposes and assigns securities to
one of six investment categories called ‘‘NAIC designations.’’ The NAIC designations parallel the credit ratings of the Nationally Recognized Statistical
Rating Organizations for marketable bonds. NAIC designations 1 and 2 include bonds considered investment grade (rated ‘‘Baa3’’ or higher by Moody’s
Investors Service (‘‘Moody’s’’), or rated ‘‘BBB–’’ or higher by Standard & Poor’s (‘‘S&P’’)) by such rating organizations. NAIC designations 3 through 6
include bonds considered below investment grade (rated ‘‘Ba1’’ or lower by Moody’s, or rated ‘‘BB+’’ or lower by S&P).
MetLife, Inc.
26