MetLife 2001 Annual Report Download - page 42
Download and view the complete annual report
Please find page 42 of the 2001 MetLife annual report below. You can navigate through the pages in the report by either clicking on the pages listed below, or by using the keyword search tool below to find specific information within the annual report.-
 1
1 -
2
-
3
-
4
-
5
-
6
-
7
-
8
-
9
-
10
-
11
-
12
-
13
-
14
-
15
-
16
-
17
-
18
-
19
-
20
-
21
-
22
-
23
-
24
-
25
-
26
-
27
-
28
-
29
-
30
-
31
-
 32
32 -
 33
33 -
 34
34 -
 35
35 -
 36
36 -
 37
37 -
 38
38 -
 39
39 -
 40
40 -
 41
41 -
 42
42 -
 43
43 -
 44
44 -
 45
45 -
 46
46 -
 47
47 -
 48
48 -
 49
49 -
 50
50 -
 51
51 -
 52
52 -
53
-
54
-
55
-
56
-
57
-
58
-
59
-
60
-
61
-
62
-
63
-
64
-
65
-
66
-
67
-
68
-
69
-
70
-
71
-
72
-
73
-
74
-
75
-
76
-
77
-
78
-
79
-
80
-
81
 |
 |

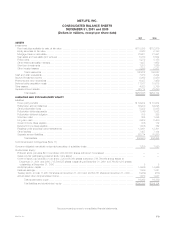
METLIFE, INC.
CONSOLIDATED BALANCE SHEETS
DECEMBER 31, 2001 and 2000
(Dollars in millions, except per share data)
2001 2000
ASSETS
Investments:
Fixed maturities available-for-sale, at fair value ************************************************************** $115,398 $112,979
Equity securities, at fair value **************************************************************************** 3,063 2,193
Mortgage loans on real estate**************************************************************************** 23,621 21,951
Real estate and real estate joint ventures ****************************************************************** 5,730 5,504
Policy loans ******************************************************************************************* 8,272 8,158
Other limited partnership interests************************************************************************* 1,637 1,652
Short-term investments ********************************************************************************* 1,203 1,269
Other invested assets ********************************************************************************** 3,298 2,821
Total investments ******************************************************************************** 162,222 156,527
Cash and cash equivalents ******************************************************************************** 7,473 3,434
Accrued investment income ******************************************************************************* 2,062 2,050
Premiums and other receivables**************************************************************************** 6,437 7,459
Deferred policy acquisition costs *************************************************************************** 11,167 10,618
Other assets ******************************************************************************************** 4,823 3,796
Separate account assets********************************************************************************** 62,714 70,250
Total assets ************************************************************************************* $256,898 $254,134
LIABILITIES AND STOCKHOLDERS’ EQUITY
Liabilities:
Future policy benefits *********************************************************************************** $ 84,924 $ 81,974
Policyholder account balances *************************************************************************** 58,923 54,095
Other policyholder funds ******************************************************************************** 5,332 5,035
Policyholder dividends payable *************************************************************************** 1,046 1,082
Policyholder dividend obligation*************************************************************************** 708 385
Short-term debt *************************************************************************************** 355 1,085
Long-term debt **************************************************************************************** 3,628 2,400
Current income taxes payable**************************************************************************** 306 112
Deferred income taxes payable*************************************************************************** 1,526 752
Payables under securities loaned transactions ************************************************************** 12,661 12,301
Other liabilities ***************************************************************************************** 7,457 7,184
Separate account liabilities******************************************************************************* 62,714 70,250
Total liabilities************************************************************************************ 239,580 236,655
Commitments and contingencies (Note 11)
Company-obligated mandatorily redeemable securities of subsidiary trusts***************************************** 1,256 1,090
Stockholders’ Equity:
Preferred stock, par value $0.01 per share; 200,000,000 shares authorized; none issued ************************* ——
Series A junior participating preferred stock; none issued ***************************************************** ——
Common stock, par value $0.01 per share; 3,000,000,000 shares authorized; 786,766,664 shares issued at
December 31, 2001 and 2000; 715,506,525 shares outstanding at December 31, 2001 and 760,681,913 shares
outstanding at December 31, 2000 ********************************************************************* 88
Additional paid-in capital ******************************************************************************** 14,966 14,926
Retained earnings************************************************************************************** 1,349 1,021
Treasury stock, at cost; 71,260,139 shares at December 31, 2001 and 26,084,751 shares at December 31, 2000*** (1,934) (613)
Accumulated other comprehensive income***************************************************************** 1,673 1,047
Total stockholders’ equity************************************************************************** 16,062 16,389
Total liabilities and stockholders’ equity ************************************************************** $256,898 $254,134
See accompanying notes to consolidated financial statements.
MetLife, Inc. F-3