MetLife 2001 Annual Report Download - page 78
Download and view the complete annual report
Please find page 78 of the 2001 MetLife annual report below. You can navigate through the pages in the report by either clicking on the pages listed below, or by using the keyword search tool below to find specific information within the annual report.-
 1
1 -
2
-
3
-
4
-
5
-
6
-
7
-
8
-
9
-
10
-
11
-
12
-
13
-
14
-
15
-
16
-
17
-
18
-
19
-
20
-
21
-
22
-
23
-
24
-
25
-
26
-
27
-
28
-
29
-
30
-
31
-
32
-
33
-
34
-
35
-
36
-
37
-
38
-
39
-
40
-
41
-
42
-
43
-
44
-
45
-
46
-
47
-
48
-
49
-
50
-
51
-
52
-
53
-
54
-
55
-
56
-
57
-
58
-
59
-
60
-
61
-
62
-
63
-
64
-
65
-
66
-
67
-
 68
68 -
 69
69 -
 70
70 -
 71
71 -
 72
72 -
 73
73 -
 74
74 -
 75
75 -
 76
76 -
 77
77 -
 78
78 -
 79
79 -
 80
80 -
 81
81
 |
 |

METLIFE, INC.
NOTES TO CONSOLIDATED FINANCIAL STATEMENTS — (Continued)
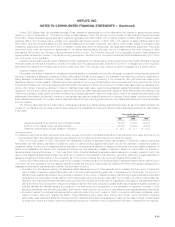
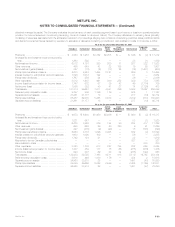
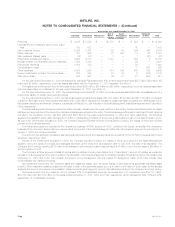
effectively manage its capital. The Company evaluates the performance of each operating segment based upon income or loss from operations before
provision for income taxes and non-recurring items (e.g. items of unusual or infrequent nature). The Company allocates non-recurring items (primarily
consisting of expenses associated with the anticipated resolution of proceedings alleging race-conscious underwriting practices, sales practices claims
and claims for personal injuries caused by exposure to asbestos or asbestos-containing products and demutualization costs) to Corporate & Other.
At or for the year ended December 31, 2001
Auto & Asset Corporate
Individual Institutional Reinsurance Home Management International & Other Total
(Dollars in millions)
Premiums *********************************** $ 4,563 $ 7,288 $1,762 $2,755 $ — $ 846 $ (2) $ 17,212
Universal life and investment-type product policy
fees ************************************** 1,260 592 — — — 38 (1) 1,889
Net investment income ************************ 6,512 4,161 390 200 71 267 322 11,923
Other revenues******************************* 495 649 42 22 198 16 85 1,507
Net investment gains (losses) ******************* 827 (15) (6) (17) 25 (16) (1,401) (603)
Policyholder benefits and claims***************** 5,233 8,924 1,484 2,121 — 689 3 18,454
Interest credited to policyholder account balances** 1,898 1,013 122 — — 51 — 3,084
Policyholder dividends ************************* 1,767 259 24 — — 36 — 2,086
Other expenses ****************************** 3,012 1,907 491 800 252 329 774 7,565
Income (loss) before provision for income taxes**** 1,747 572 67 39 42 46 (1,774) 739
Net income (loss) ***************************** 1,095 382 40 41 27 14 (1,126) 473
Total assets********************************** 131,314 89,661 7,911 4,581 256 5,308 17,867 256,898
Deferred policy acquisition costs **************** 8,757 509 1,196 179 — 525 1 11,167
Separate account assets ********************** 31,261 31,177 13 — — 277 (14) 62,714
Policyholder liabilities ************************** 88,287 52,075 5,355 2,610 — 3,419 (813) 150,933
Separate account liabilities ********************* 31,261 31,177 13 — — 277 (14) 62,714
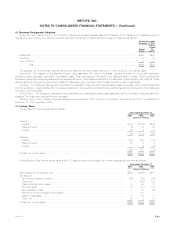
At or for the year ended December 31, 2000
Auto & Asset Corporate
Individual Institutional Reinsurance Home Management International & Other Total
(Dollars in millions)
Premiums *********************************** $ 4,673 $ 6,900 $1,450 $2,636 $ — $ 660 $ (2) $ 16,317
Universal life and investment-type product policy
fees ************************************** 1,221 547 — — — 53 (1) 1,820
Net investment income ************************ 6,475 3,959 379 194 90 254 417 11,768
Other revenues******************************* 650 650 29 40 760 9 91 2,229
Net investment gains (losses) ******************* 227 (475) (2) (20) — 18 (138) (390)
Policyholder benefits and claims***************** 5,054 8,178 1,096 2,005 — 562 (2) 16,893
Interest credited to policyholder account balances** 1,680 1,090 109 — — 56 — 2,935
Policyholder dividends ************************* 1,742 124 21 — — 32 — 1,919
Payments to former Canadian policyholders ******* — — — — — 327 — 327
Demutualization costs ************************* — — — — — — 230 230
Other expenses ****************************** 3,323 1,730 513 827 784 292 555 8,024
Income (loss) before provision for income taxes**** 1,447 459 117 18 66 (275) (416) 1,416
Net income (loss) ***************************** 920 307 69 30 34 (285) (122) 953
Total assets********************************** 132,433 89,725 7,163 4,511 418 5,119 14,765 254,134
Deferred policy acquisition costs **************** 8,610 446 1,030 176 — 354 2 10,618
Separate account assets ********************** 34,860 33,918 28 — — 1,491 (47) 70,250
Policyholder liabilities ************************** 84,049 49,669 5,028 2,559 — 2,435 (1,169) 142,571
Separate account liabilities ********************* 34,860 33,918 28 — — 1,491 (47) 70,250
MetLife, Inc. F-39