MetLife 2001 Annual Report Download - page 12
Download and view the complete annual report
Please find page 12 of the 2001 MetLife annual report below. You can navigate through the pages in the report by either clicking on the pages listed below, or by using the keyword search tool below to find specific information within the annual report.-
 1
1 -
 2
2 -
 3
3 -
 4
4 -
 5
5 -
 6
6 -
 7
7 -
 8
8 -
 9
9 -
 10
10 -
 11
11 -
 12
12 -
 13
13 -
 14
14 -
 15
15 -
 16
16 -
 17
17 -
 18
18 -
 19
19 -
 20
20 -
 21
21 -
 22
22 -
23
-
24
-
25
-
26
-
27
-
28
-
29
-
30
-
31
-
32
-
33
-
34
-
35
-
36
-
37
-
38
-
39
-
40
-
41
-
42
-
43
-
44
-
45
-
46
-
47
-
48
-
49
-
50
-
51
-
52
-
53
-
54
-
55
-
56
-
57
-
58
-
59
-
60
-
61
-
62
-
63
-
64
-
65
-
66
-
67
-
68
-
69
-
70
-
71
-
72
-
73
-
74
-
75
-
76
-
77
-
78
-
79
-
80
-
81
 |
 |
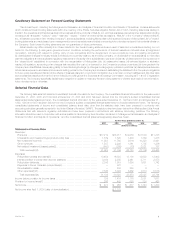
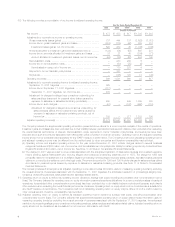
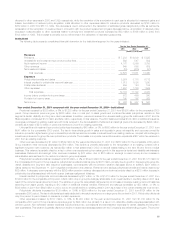
contributed to the $312 million premium growth in the Reinsurance segment. A $186 million rise in the International segment is due to growth in Mexico,
South Korea, Spain and Taiwan, as well as acquisitions in Brazil and Chile. These variances were partially offset by a decline in Argentinean individual life
premiums, reflecting the impact of recent economic and political events in that country. If these conditions continue, management expects further
declines in Argentinean premiums. Higher average premium resulting from rate increases is the primary driver of a $119 million rise in the Auto & Home
segment. A $110 million decline in the Individual segment is attributable to lower sales of traditional life insurance policies, which reflects a continued shift
in customer preference from those policies to variable life products.
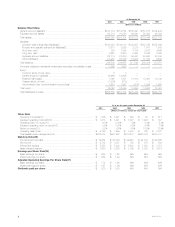
Universal life and investment-type product policy fees increased by $69 million, or 4%, to $1,889 million for the year ended December 31, 2001
from $1,820 million for the comparable 2000 period. This variance is due to increases in the Institutional and Individual segments, partially offset by a
decline in the International segment. Growth in sales and deposits of group universal life and corporate-owned life insurance products resulted in a
$45 million increase in the Institutional segment. A $39 million rise in the Individual segment is predominately the result of higher fees from variable life
products reflecting a shift in customer preferences from traditional life products. A decrease of $15 million in the International segment is primarily due to
reduced fees in Spain resulting from fewer assets under management. This is a result of a planned cessation of product lines offered through a joint
venture with Banco Santander Central Hispano, S.A. (‘‘Banco Santander’’).
Net investment income increased by $155 million, or 1%, to $11,923 million for the year ended December 31, 2001 from $11,768 million for the
comparable 2000 period. This change is due to higher income from (i) mortgage loans on real estate of $155 million, or 9%, (ii) other invested assets of
$87 million, or 54%, (iii) fixed maturities of $36 million, or less than 1%, and (iv) interest on policy loans of $21 million, or 4%. These positive variances are
partially offset by lower income from (i) equity securities and other limited partnership interests of $86 million, or 47%, (ii) real estate and real estate joint
ventures, net of investment expenses and depreciation, of $45 million, or 7%, and (iii) cash, cash equivalents and short-term investments of $9 million, or
3%, and higher investment expenses of $4 million, or 2%.
The increase in income from mortgage loans on real estate to $1,848 million in 2001 from $1,693 million in 2000 is predominately the result of
higher mortgage production volume and increases in mortgage prepayment fees and contingent interest. Income from other invested assets increased to
$249 million in 2001 from $162 million in 2000 primarily due to the reclassification of $19 million from other comprehensive income related to cash flow
hedges, $24 million from derivatives not designated as accounting hedges and the recognition in 2000 of a $20 million loss on an equity method
investment. The improvement in income from fixed maturities to $8,574 million in 2001 from $8,538 million in 2000 is primarily due to bond prepayments
and increased securities lending activity, offset by lower yields on re-investments. The expense associated with securities lending activity is included in
other expenses. The reduction of income from equity securities and other limited partnership interests to $97 million in 2001 from $183 million in 2000 is
primarily due to fewer sales of underlying assets held in corporate partnerships and increased partnership write-downs. The decrease in income from real
estate and real estate joint ventures to $584 million in 2001 from $629 million in 2000 is primarily due to a decline in hotel occupancy rates and reduced
real estate joint venture sales.
The increase in net investment income is largely attributable to positive variances in the Institutional and Individual segments, partially offset by a
decline in Corporate & Other. Net investment income for the Institutional and Individual segments grew by $202 million and $37 million, respectively.
These increases are predominately due to a higher volume of securities lending activity, increases in bond and mortgage prepayments and higher
contingent interest on mortgages. The decrease in Corporate & Other is principally the result of sales in 2000 of underlying assets held in corporate
limited partnerships. The remainder of the variance is attributable to smaller fluctuations in the other segments.
Other revenues decreased by $722 million, or 32%, to $1,507 million for the year ended December 31, 2001 from $2,229 million for the
comparable 2000 period. This variance is mainly attributable to reductions in the Asset Management, Individual and Auto & Home segments, partially
offset by an increase in the Reinsurance segment. The sales of Nvest and Conning on October 30, 2000 and July 2, 2001, respectively, are the primarily
drivers of a $562 million decline in the Asset Management segment. A decrease of $155 million in the Individual segment is primarily due to reduced
commission and fee income associated with lower sales in the broker/dealer and other subsidiaries which was a result of the equity market downturn.
Such commission and fee income can fluctuate consistent with movements in the equity market. Auto & Home’s other revenues are lower by $18 million
primarily due to a revision of an estimate made in 2000 of amounts recoverable from reinsurers related to the disposition of this segment’s reinsurance
business in 1990. Other revenues in the Reinsurance segment improved by $13 million due to an increase in fees earned on financial reinsurance,
primarily as a result of the acquisition of the remaining interest in RGA Financial Group, LLC during the second half of 2000.
The Company’s investment gains and losses are net of related policyholder amounts. The amounts netted against investment gains and losses are
(i) deferred policy acquisition amortization, to the extent that such amortization results from investment gains and losses, (ii) additions to participating
contractholder accounts when amounts equal to such investment gains and losses are credited to the contractholder’s accounts, and (iii) adjustments to
the policyholder dividend obligation resulting from investment gains and losses.
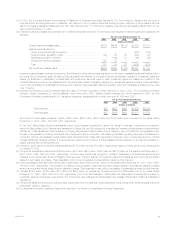
Net investment losses grew by $213 million, or 55%, to $603 million for the year ended December 31, 2001 from $390 million for the comparable
2000 period. This increase reflects total gross investment losses of $737 million, an increase of $293 million, or 66%, from $444 million in 2000, before
offsets for: the amortization of deferred policy acquisition costs of $(25) million and $95 million in 2001 and 2000, respectively; changes in policyholder
dividend obligation of $159 million and $85 million in 2001 and 2000, respectively; and additions to participating contracts of $126 million in 2000.
Excluding the net gain on the sale of a subsidiary, net investment losses decreased from the prior year. The Company continues to recognize
deteriorating credits through the proactive sale of certain assets.
The Company believes its policy of netting related policyholder amounts against investment gains and losses provides important information in
evaluating its operating performance. Investment gains and losses are often excluded by investors when evaluating the overall financial performance of
insurers. The Company believes its presentation enables readers of its consolidated statements of income to easily exclude investment gains and losses
and the related effects on the consolidated statements of income when evaluating its operating performance. The Company’s presentation of investment
gains and losses, net of related policyholder amounts, may be different from the presentation used by other insurance companies and, therefore,
amounts in its consolidated statements of income may not be comparable to amounts reported by other insurers.
Policyholder benefits and claims rose by $1,561 million, or 9%, to $18,454 million for the year ended December 31, 2001 from $16,893 million for
the comparable 2000 period. This variance reflects total gross policyholder benefits and claims of $18,295 million, an increase of $1,361 million, or 8%,
from $16,934 million in 2000, before the offsets for reductions in participating contractholder accounts of $126 million in 2000 and changes in the
policyholder dividend obligation of $159 million and $(85) million in 2001 and 2000, respectively, directly related to net investment losses. The net
variance in policyholder benefits and claims is mainly attributable to increases in the Institutional, Reinsurance, Individual, International and Auto & Home
segments. Claims related to the September 11, 2001 tragedies and fourth quarter business realignment initiatives account for $291 million and
$215 million, respectively, of a $746 million increase in the Institutional segment. The remainder of the fluctuation is attributable to growth in the group life,
MetLife, Inc. 9