MetLife 2001 Annual Report Download - page 23
Download and view the complete annual report
Please find page 23 of the 2001 MetLife annual report below. You can navigate through the pages in the report by either clicking on the pages listed below, or by using the keyword search tool below to find specific information within the annual report.-
 1
1 -
2
-
3
-
4
-
5
-
6
-
7
-
8
-
9
-
10
-
11
-
12
-
 13
13 -
 14
14 -
 15
15 -
 16
16 -
 17
17 -
 18
18 -
 19
19 -
 20
20 -
 21
21 -
 22
22 -
 23
23 -
 24
24 -
 25
25 -
 26
26 -
 27
27 -
 28
28 -
 29
29 -
 30
30 -
 31
31 -
 32
32 -
 33
33 -
34
-
35
-
36
-
37
-
38
-
39
-
40
-
41
-
42
-
43
-
44
-
45
-
46
-
47
-
48
-
49
-
50
-
51
-
52
-
53
-
54
-
55
-
56
-
57
-
58
-
59
-
60
-
61
-
62
-
63
-
64
-
65
-
66
-
67
-
68
-
69
-
70
-
71
-
72
-
73
-
74
-
75
-
76
-
77
-
78
-
79
-
80
-
81
 |
 |

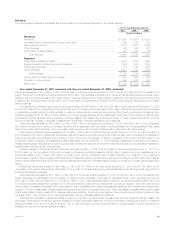
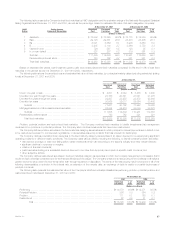
administrative expenses increased by $5 million, or 5%, to $99 million in 2000 from $94 million in 1999. This increase is primarily due to increased mutual
fund expense subsidies, distribution costs and system enhancements.
Minority interest, reflecting third-party ownership interest in Nvest, decreased by $19 million, or 35%, to $35 million in 2000 from $54 million in 1999.
International
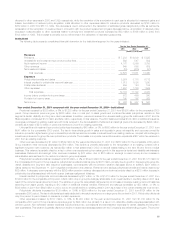
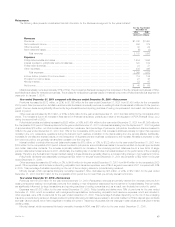
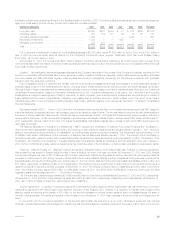
The following table presents consolidated financial information for the International segment for the years indicated:
For the Year Ended
December 31,
2001 2000 1999
(Dollars in millions)
Revenues
Premiums**************************************************************************** $ 846 $ 660 $523
Universal life and investment-type product policy fees *************************************** 38 53 43
Net investment income **************************************************************** 267 254 206
Other revenues *********************************************************************** 16 9 12
Net investment (losses) gains *********************************************************** (16) 18 1
Total revenues ******************************************************************** 1,151 994 785
Expenses
Policyholder benefits and claims ********************************************************* 689 562 458
Interest credited to policyholder account balances ****************************************** 51 56 52
Policyholder dividends ***************************************************************** 36 32 22
Payments to former Canadian policyholders *********************************************** — 327 —
Other expenses ********************************************************************** 329 292 248
Total expenses ******************************************************************* 1,105 1,269 780
Income (Loss) before provision for income taxes ******************************************* 46 (275) 5
Provision (Benefit) for income taxes ****************************************************** 32 10 (16)
Net income (loss) ********************************************************************* $ 14 $ (285) $ 21
Year ended December 31, 2001 compared with the year ended December 31, 2000—International
Premiums increased by $186 million, or 28%, to $846 million for the year ended December 31, 2001 from $660 million for the comparable 2000
period. Mexico’s premiums grew by $89 million due to additional sales in group life, major medical and individual life products. Protection-type product
sales fostered by the continued expansion of the professional sales force in South Korea accounted for an additional $41 million in premiums. Spain’s
premiums rose by $18 million primarily due to continued growth in the direct auto business. Higher individual life sales resulted in an additional $17 million
in Taiwanese premiums. The 2001 acquisition of Seasul in Brazil and the Chilean acquisitions increased premiums by $12 million and $7 million,
respectively, in those countries. Hong Kong’s premiums grew by $5 million primarily due to continued growth in the direct marketing, group life, and
traditional life businesses. These variances were partially offset by a $3 million decline in Argentinean individual life premiums, reflecting the impact of
recent economic and political events in that country. If these conditions continue, management expects further declines in Argentinean premiums. The
remainder of the variance is attributable to minor fluctuations in several countries.
Universal life and investment-type product policy fees decreased by $15 million, or 28%, to $38 million for the year ended December 31, 2001 from
$53 million for the comparable 2000 period. This decline is primarily attributable to a $19 million reduction in fees in Spain caused by a reduction in
assets under management, as a result of a planned cessation of product lines offered through a joint venture with Banco Santander. The remainder of the
variance is attributable to minor fluctuations in several countries.
Other revenues increased by $7 million, or 78%, to $16 million for the year ended December 31, 2001 from $9 million for the comparable 2000
period. Argentina’s other revenues grew by $5 million primarily due to foreign currency transaction gains in the private pension business, which was
introduced in the third quarter of 2001. The required accounting for foreign currency translation fluctuations in Indonesia, a highly inflationary economy,
resulted in a $3 million increase in other revenues. These variances were partially offset by a $3 million decrease in Taiwan due to higher group
reinsurance commissions received in 2000. The remainder of the increase is attributable to minor variances in several countries.
Policyholder benefits and claims increased by $127 million, or 23%, to $689 million for the year ended December 31, 2001 from $562 million for the
comparable 2000 period. Mexico’s, South Korea’s and Taiwan’s policyholder benefits and claims grew by $74 million, $24 million and $15 million,
respectively, commensurate with the overall premium variance discussed above. Brazil’s policyholder benefits and claims rose by $9 million primarily due
to the acquisition of Seasul. In addition, the Chilean acquisitions contributed $7 million to this variance. These variances are partially offset by a $7 million
decline in Argentina’s policyholder benefits and claims as a result of the impact of recent economic and political events in that country. The remainder of
the variance is attributable to minor fluctuations in several countries.
Interest credited to policyholder account balances decreased by $5 million, or 9%, to $51 million for the year ended December 31, 2001 from
$56 million for the comparable 2000 period. An overall decline in crediting rates on interest-sensitive products in 2001 as a result of the current interest
rate environment is primarily responsible for a $6 million reduction in South Korea. Spain’s interest credited dropped by $6 million due to a reduction in
assets under management, as a result of a planned cessation of product lines offered through a joint venture with Banco Santander. These variances
were partially offset by a $2 million increase in both Mexico and Argentina, due to an increase in average customer account balances. Although
Argentinean average customer account balances increased in 2001, management expects there will be a future reduction in assets under management
as a result of the recent economic and political events in that country. However, government-imposed withdrawal restrictions as well as contract terms,
specifically surrender charges, may moderate the impact. The remainder of the variance is attributable to minor fluctuations in several countries.
Policyholder dividends increased by $4 million, or 13%, to $36 million for the year ended December 31, 2001 from $32 million for the comparable
2000 period. The growth in Mexico’s group life sales mentioned above resulted in an increase in policyholder dividends of $2 million. Taiwan’s individual
life sales contributed an additional $2 million in policyholder dividends. The remainder of the variance is attributable to minor fluctuations in several
countries.
MetLife, Inc.
20